STA1003: Fundamental Statistics
Confidence Interval for a Proportion
Overview:
What is meant by a confidence interval;
How to calculate a confidence interval for a proportion;
What is meant by a 90%, 95%, 98% or 99% confidence interval;
How to find a sample size;
Margin of error.
Introduction:
So far, we have taken samples from a known population
Usually the details about the population are unknown
So (for example) µ and p are unknown
In general, we take a sample to find out about the unknown population to
draw conclusions about parameters (inference)
Samples and populations:
Statistics are numbers describing samples
Parameters are numbers describing populations
Usually, Roman letters denote statistics (eg. y, s)
Usually, Greek letters denote parameters (eg. µ, σ)
Each statistic has an associated parameter
Parameters are usually unknown, and estimated by statistics
For Example…
To estimate the population mean, use the sample mean
But different samples will produce different sample means y, and hence
different estimates of µ
How confident are we in our estimate of µ?
(We’d be more confident in results from larger samples)
We can construct a confidence interval for µ
To estimate the population proportion, use the sample proportion
But different samples will produce different sample proportions pb, and
hence different estimates of p
How confident are we in our estimate of p?
(We’d be more confident in results from larger samples)
We can construct a confidence interval for p
, STA1003: Fundamental Statistics
Recall:
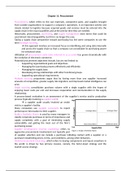
Because the sampling distribution of pb has a Normal model. . .
. . . we can use the 68–95–99.7 rule:
o 68% of the sample proportions are within one SE of p
o 95% of the sample proportions are within two SE of p
o 99.7% of the sample proportions are within three SE of p
Sample proportions:
Think from the p point-of-view
Confidence intervals:
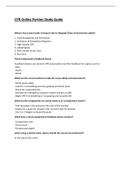
A typical confidence interval looks like this:
The 95% confidence interval for p is from 0.25 to 0.35
or simply (0.25, 0.35).
Or we write it like this:
The 95% confidence interval for p is 0.30 ± 0.05
The ‘±’ means ‘plus and minus’, so it means
Lower limit = 0.30 − 0.05 = 0.25
Upper limit = 0.30 + 0.05 = 0.35
Confidence Interval for a Proportion
Overview:
What is meant by a confidence interval;
How to calculate a confidence interval for a proportion;
What is meant by a 90%, 95%, 98% or 99% confidence interval;
How to find a sample size;
Margin of error.
Introduction:
So far, we have taken samples from a known population
Usually the details about the population are unknown
So (for example) µ and p are unknown
In general, we take a sample to find out about the unknown population to
draw conclusions about parameters (inference)
Samples and populations:
Statistics are numbers describing samples
Parameters are numbers describing populations
Usually, Roman letters denote statistics (eg. y, s)
Usually, Greek letters denote parameters (eg. µ, σ)
Each statistic has an associated parameter
Parameters are usually unknown, and estimated by statistics
For Example…
To estimate the population mean, use the sample mean
But different samples will produce different sample means y, and hence
different estimates of µ
How confident are we in our estimate of µ?
(We’d be more confident in results from larger samples)
We can construct a confidence interval for µ
To estimate the population proportion, use the sample proportion
But different samples will produce different sample proportions pb, and
hence different estimates of p
How confident are we in our estimate of p?
(We’d be more confident in results from larger samples)
We can construct a confidence interval for p
, STA1003: Fundamental Statistics
Recall:
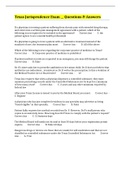
Because the sampling distribution of pb has a Normal model. . .
. . . we can use the 68–95–99.7 rule:
o 68% of the sample proportions are within one SE of p
o 95% of the sample proportions are within two SE of p
o 99.7% of the sample proportions are within three SE of p
Sample proportions:
Think from the p point-of-view
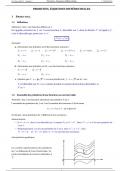
Confidence intervals:
A typical confidence interval looks like this:
The 95% confidence interval for p is from 0.25 to 0.35
or simply (0.25, 0.35).
Or we write it like this:
The 95% confidence interval for p is 0.30 ± 0.05
The ‘±’ means ‘plus and minus’, so it means
Lower limit = 0.30 − 0.05 = 0.25
Upper limit = 0.30 + 0.05 = 0.35