100% satisfaction guarantee Immediately available after payment Both online and in PDF No strings attached
logo-home
2.2P - Practical Assignment 5 - Solutions - Manana Mañana $3.23   Add to cart

Presentation

2.2P - Practical Assignment 5 - Solutions - Manana Mañana

 7 views  0 purchase
  • Course
  • Institution

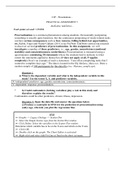
2.2P - Practical Assignment 5 - Solutions - Manana Mañana. Answers to the 5th practical assignment for Bachelor 2 Statistics. The presentation is due coming Friday Oct 28. Syntax used is .

Last document update: 2 year ago

Preview 2 out of 7  pages

  • October 26, 2022
  • October 26, 2022
  • 7
  • 2022/2023
  • Presentation
  • Unknown
avatar-seller
2.2P – Presentations –

PRACTICAL ASSIGNMENT 5
MAÑANA, MAÑANA…
Used syntax set seed = 123456.

Procrastination is a common phenomenon among students. Occasionally postponing
something is usually quite harmless, but the continuous postponing of study-related tasks
can have serious consequences such as fear, remorse, falling behind, lost opportunities,
etc. Rabin, Fogel and Nutter-Upham (2011) (see PsyWeb/ EduWeb) carried out research
to discover several predictors of procrastination. In this assignment, we will
investigate a number of these predictors, i.e.: age, gender, neuroticism (emotional
stability) and conscientiousness (orderliness). Procrastination is measured using a
questionnaire containing 20 statements where the students had to indicate to what
extent the statements applied to themselves (1=does not apply at all, 5=applies
completely). Here’s an example of such a statement: “I am often completing tasks that I
wanted to complete days ago.” The data is located in the file Mañana_Many.sav. Draw a
random sample of 100 participants for this data file (see: Mañana_sample.sps).

Question 1.
a) What is the dependent variable and what is the independent variable in this
study? Use the terms X, Y, and predictor variables.
X/ independent/ predictor: age, gender, neuroticism, conscientiousness.
Y/ dependent/ response: procrastination.

* b) Could confounders (lurking variables) play a role in this study and
therefore explain the results?
Confounders could be other predictors, chronic illness, depression.

Question 2. Open the data file and answer the questions below.
a) Produce a scatterplot in SPSS for the prediction of procrastination using
(only) age, wherein you plot the regression line.

SPSS
⇒ Graphs -> Legacy Dialogs -> Scatter/Dot
⇒ Select the Simple Scatter type from the Scatter/Dot window
⇒ Click Define. Select the variables in the Scatter Plot window.
Determine which variable has to be on the X-axis and which on the Y-axis
⇒ Click OK.
⇒ Double click on the graph. The Chart Editor is activated
⇒ Right-click and select Add Fit Line at Total in the short cut menu.


1

, b) Inspect the data points and the value of R2. In general, what can you say
about the way in which these data points are distributed? What can you
conclude about the strength of the linear relationship?
R can be found at the top right corner of the graph (0.010). Thus age explains 1% of
2

variance (measure of how far observed values are away from the regression
line/average predicted values) for procrastination. There’s almost 0 correlation:
super weak.

c) Within which range of values do the procrastination scores vary for students
that are 18 years old? And, for students aged 26? Can the spread around
the regression line be considered constant?
If you look at the graph:
Age 18 ➝ Y axis point 49 till 84
Age 26 ➝ Y axis point 42 till 72
Which means age does not matter as both procrastinate similarly. Not constant as some
parts are more spread.

Question 3. Now, perform regression analysis to predict procrastination based on
(only) age.

SPSS
⇒ Analyze -> Regression -> Linear
⇒ Select the correct variables for Dependent and Independent(s)
⇒ Click Statistics. Tick Descriptive and Confidence intervals.
⇒ Click Plots and tick normal probability plot.
⇒ Click Continue and then OK.

2

The benefits of buying summaries with Stuvia:

Guaranteed quality through customer reviews

Guaranteed quality through customer reviews

Stuvia customers have reviewed more than 700,000 summaries. This how you know that you are buying the best documents.

Quick and easy check-out

Quick and easy check-out

You can quickly pay through credit card or Stuvia-credit for the summaries. There is no membership needed.

Focus on what matters

Focus on what matters

Your fellow students write the study notes themselves, which is why the documents are always reliable and up-to-date. This ensures you quickly get to the core!

Frequently asked questions

What do I get when I buy this document?

You get a PDF, available immediately after your purchase. The purchased document is accessible anytime, anywhere and indefinitely through your profile.

Satisfaction guarantee: how does it work?

Our satisfaction guarantee ensures that you always find a study document that suits you well. You fill out a form, and our customer service team takes care of the rest.

Who am I buying these notes from?

Stuvia is a marketplace, so you are not buying this document from us, but from seller DonnaDahlia. Stuvia facilitates payment to the seller.

Will I be stuck with a subscription?

No, you only buy these notes for $3.23. You're not tied to anything after your purchase.

Can Stuvia be trusted?

4.6 stars on Google & Trustpilot (+1000 reviews)

66579 documents were sold in the last 30 days

Founded in 2010, the go-to place to buy study notes for 14 years now

Start selling
$3.23
  • (0)
  Add to cart