100% satisfaction guarantee Immediately available after payment Both online and in PDF No strings attached
logo-home
Summary Cost-Volume-Profit Analysis $2.60   Add to cart

Summary

Summary Cost-Volume-Profit Analysis

 3 views  0 purchase
  • Course
  • Institution
  • Book

It contains summary of chapter 3 of "Cost Accounting: A Managerial Approach" book from Charles T. Horngren, Srikant M. Datar, and Madhav V. Rajan. It is written concisely based on learning objectives of the chapter.

Preview 2 out of 5  pages

  • No
  • Chapter 3
  • November 12, 2022
  • 5
  • 2017/2018
  • Summary
avatar-seller
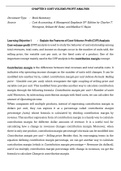
CHAPTER 3: COST-VOLUME-PROFIT ANALYSIS


Document Type : Book Summary
Source : Cost Accounting: A Managerial Emphasis 15th Edition by Charles T.
Horngren, Srikant M. Datar, and Madhav V. Rajan


Learning Objective 1 : Explain the Features of Cost–Volume–Profit (CVP) Analysis
Cost-volume-profit (CVP) analysis is used to study the behavior of and relationship among
total revenues, total costs, and income as changes occur in the number of units sold, the
selling price, the variable cost per unit, or the fixed costs of a product. One of the
important concept mainly used in the CVP analysis is the contribution margin concept.


Contribution margin is the difference between total revenues and total variable costs. It
indicates why operating income changes as the number of units sold changes. It can be
modified into another form, called contribution margin per unit (whose formula: Selling
price - Variable cost per unit), which recognizes the tight coupling of selling price and
variable cost per unit. This modified form provides another way to calculate contribution
margin through the following formula: Contribution margin per unit × Number of units
sold. Moreover, by subtracting contribution margin with fixed costs, we can calculate the
amount of Operating income.
When companies sell multiple products, instead of expressing contribution margin in
dollars per unit, they can express it as a percentage called contribution margin
percentage (ratio), whose formula is calculated by dividing contribution margin by
revenue. This another expression form of contribution margin is a handy way to calculate
contribution margin for different dollar amounts of revenue. It is a useful tool for
calculating how a change in revenues changes contribution margin. Moreover, when
there is only one product, contribution margin percentage’s formula can be modified into
Contribution margin per unit ÷ Selling price. Besides that, by rearranging terms in the
equation defining contribution margin percentage, we can get another way to calculate
contribution margin (which is Contribution margin percentage × Revenues (in dollars)),
and if we multiply contribution margin percentage with change in revenues, we get the
formula to calculate Change in contribution margin.

, CVP relationships can expressed through three methods:
 The equation method


 The contribution margin method


 The graph method


Different method are useful for different decisions. The equation method and the
contribution method are most useful when managers want to determine operating
income at a few specific sales levels. While, the graph method helps managers visualize
the relationship between units sold and operating income over a wide range of quantities.


There are four cost-volume-profit assumptions, as follows:
 Changes in revenues and costs arise only because of changes in the number of
product units sold;
 Total costs can be separated into a fixed component and a variable component ;
 When represented graphically, the behaviors of total revenues and total costs are
linear in relation to units sold within a relevant range; and
 Selling price, variable cost per unit, and total fixed costs are known and constant.


Learning Objective 2 : Determine the Breakeven Point and Output Level Needed to
Achieve a Target Operating Income
The breakeven point (BEP) is the quantity of output sold at which total revenues equal
total costs, or in other words, the one that results in $0 operating income. BEP can be
calculated using below formula.

The benefits of buying summaries with Stuvia:

Guaranteed quality through customer reviews

Guaranteed quality through customer reviews

Stuvia customers have reviewed more than 700,000 summaries. This how you know that you are buying the best documents.

Quick and easy check-out

Quick and easy check-out

You can quickly pay through credit card or Stuvia-credit for the summaries. There is no membership needed.

Focus on what matters

Focus on what matters

Your fellow students write the study notes themselves, which is why the documents are always reliable and up-to-date. This ensures you quickly get to the core!

Frequently asked questions

What do I get when I buy this document?

You get a PDF, available immediately after your purchase. The purchased document is accessible anytime, anywhere and indefinitely through your profile.

Satisfaction guarantee: how does it work?

Our satisfaction guarantee ensures that you always find a study document that suits you well. You fill out a form, and our customer service team takes care of the rest.

Who am I buying these notes from?

Stuvia is a marketplace, so you are not buying this document from us, but from seller kennywiyarta. Stuvia facilitates payment to the seller.

Will I be stuck with a subscription?

No, you only buy these notes for $2.60. You're not tied to anything after your purchase.

Can Stuvia be trusted?

4.6 stars on Google & Trustpilot (+1000 reviews)

80796 documents were sold in the last 30 days

Founded in 2010, the go-to place to buy study notes for 14 years now

Start selling
$2.60
  • (0)
  Add to cart