100% satisfaction guarantee Immediately available after payment Both online and in PDF No strings attached
logo-home
Summary Introduction to Research in Marketing - All Lectures $8.13   Add to cart

Summary

Summary Introduction to Research in Marketing - All Lectures

 17 views  1 purchase
  • Course
  • Institution

Summary of all the lectures for the course Introduction to Research in Marketing. Not in a bullet-list type of way so you have to figure everything out yourself, but in clear, concise language. This file contains all the material discussed in the lectures and web clips.

Preview 4 out of 33  pages

  • December 21, 2022
  • 33
  • 2022/2023
  • Summary
avatar-seller
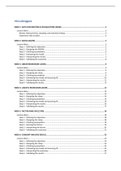
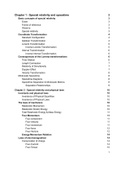
Inhoudsopgave

WEEK 1: DATA EXPLORATION & VISUALIZATION (30/08) ................................................................................ 3
Lecture Notes ...................................................................................................................................................... 3
Review: Measurement, sampling, and statistical testing .............................................................................. 3
Exploratory data analysis ............................................................................................................................... 4

WEEK 2: ANOVA (06/09) ................................................................................................................................. 5
Lecture Notes ...................................................................................................................................................... 5
Step 1 – Defining the objectives .................................................................................................................... 5
Step 2 – Designing the ANOVA ...................................................................................................................... 5
Step 3 – Checking assumptions...................................................................................................................... 6
Step 4 – Estimating the model ....................................................................................................................... 7
Step 5 – Interpreting the results .................................................................................................................... 7
Step 6 – Validating the outcomes .................................................................................................................. 8

WEEK 3: LINEAR REGRESSION (13/09) ............................................................................................................. 9
Lecture Notes ...................................................................................................................................................... 9
Step 1 – Defining the objectives .................................................................................................................... 9
Step 2 – Designing the study.......................................................................................................................... 9
Step 3 – Checking Assumptions ..................................................................................................................... 9
Step 4 – Estimating the model and assessing fit .......................................................................................... 10
Step 5 – Interpreting the results .................................................................................................................. 11
Step 6 – Validating the results ..................................................................................................................... 12

WEEK 4: LOGISTIC REGRESSION (20/09) ........................................................................................................ 13
Lecture Notes .................................................................................................................................................... 13
Step 1 – Defining the objectives .................................................................................................................. 13
Step 2 – Designing the study........................................................................................................................ 13
Step 3 – Checking assumptions.................................................................................................................... 13
Step 4 – Estimating the model and assessing fit .......................................................................................... 14
Step 5 – Interpreting the results .................................................................................................................. 16
Step 6 – Validating the results ..................................................................................................................... 17

WEEK 5: FACTOR ANALYSIS (27/09) .............................................................................................................. 18
Lecture Notes .................................................................................................................................................... 18
Step 1 – Defining the objectives .................................................................................................................. 18
Step 2 – Designing the study........................................................................................................................ 18
Step 3 – Checking assumptions.................................................................................................................... 19
Step 4 – Deriving the factors........................................................................................................................ 19
Step 5 – Interpreting the factors.................................................................................................................. 20
Step 6 – Validating the outcomes ................................................................................................................ 21

WEEK 6: CONJOINT ANALYSIS (04/10) ........................................................................................................... 23
Lecture Notes .................................................................................................................................................... 23
Step 1 – Defining the objectives .................................................................................................................. 23
Step 2 – Designing the study........................................................................................................................ 23
Step 3 – Checking assumptions.................................................................................................................... 25
Step 4 – Estimating the model and assessing fit .......................................................................................... 25
Step 5 – Interpreting the outcomes ............................................................................................................. 26
Step 6 – Validating the results ..................................................................................................................... 27

,WEEK 7: CLUSTER ANALYSIS (11/10) ............................................................................................................. 28
Lecture Notes .................................................................................................................................................... 28
Step 1 – Defining the objectives .................................................................................................................. 28
Step 2 – Designing the study........................................................................................................................ 28
Step 3 – Checking assumptions.................................................................................................................... 30
Step 4 – Deriving the clusters ...................................................................................................................... 30
Step 5 – Interpreting the clusters ................................................................................................................ 33
Step 6 – Validating and profiling the clusters .............................................................................................. 33

,WEEK 1: DATA EXPLORATION & VISUALIZATION (30/08)

Literature
Lecture notes.

Assignment.


Lecture Notes
The course Introduction to Research in Marketing provides students a toolbox to approach marketing-
related problems from a rigorous, analytical, data-based perspective.

Review: Measurement, sampling, and statistical testing
The total error framework is depicted on the right. All three
“hidden” components of the total error framework will be
discussed.

A sample is a subset of the population, often meant to be
representative. However, sampling error can occur. A
sampling error is a statistical error that occurs when an
analyst does not select a sample that represents the
entire population of data. An example of this was given in the lecture with polling stations that call
voters during elections to get an indication of what the population will vote. Several errors can be
made. First, a coverage error: only voters with a phone are singled out. Next, a sample error might occur,
for instance, when you only call phone numbers that end with a random digit. Lastly, a non-response
error might occur, where respondents do not accept the call.
In practice, every survey first samples, and then adjusts their results with post-stratification weights. This
makes your sample closer to the population.

Measurement scales can be both non-metric and metric (also called continuous). Non-metric scales can
be divided between nominal (categorical) and ordinal. Non-metric scales measure only the direction of
the response. For example, yes or no. Metric scales can be divided between interval and ratio. In
contrast to non-metric scales, metric scales not only measure direction or classification, but the
intensity as well.
The number in a nominal scale only serves as a label or a tag for identifying or classifying objects.
Examples are your student number, or your gender. Note that these are mutually exclusive (you cannot
have multiple student numbers), and at the same time collectively exhaustive (you need to have at least
one student number). Ordinal scales are assigned to objects to indicate the relative positions of some
characteristics of the object. An example is a ranking, for example, brands.

, The number in an interval is assigned to objects to indicate the relative positions of some characteristic
of objects with differences between objects being comparable.
Examples are the Likert scale (1–7), or temperature (Fahrenheit
or Celsius). The most precise scale is the ratio. Examples are your
weight, height, age, and temperature (Kelvin). Note that the main
difference between an interval and ratio, is that the latter has an
absolute zero point (it cannot get physically colder than 0 Kelvin,
your height cannot be smaller than 0 cm, etc.).
In marketing, we are often interested in measuring attitudes,
feelings, or beliefs, which are more abstract than say age, or
income. We can use a summated scale, more than one question
needed, to reduce measurement error.
A last important aspect to measurement is the validity (does it
measure what it is supposed to? Do the coefficients make sense)
and the reliability (is it stable?).

The last aspect of the total error framework is the statistical
error. We refer to hypothesis testing. Here, there are two possible
outcomes: (i) we fail to reject the null (the null is true), or (ii) we
reject the null (the alternative is true). Two types of errors can
occur when hypothesis testing. The type 1 error happens when
you reject the null based on your data, while in reality the null hypothesis is true. This is called a false
positive. The type 2 error happens when you fail to reject the null hypothesis, while in reality there is a
difference (the null can be rejected). This is called a false negative. The table on the previous page
depicts these errors.
From previous courses, recall the p-value. The p-value is the probability of the observed data or
statistic, given that the null hypothesis is true. If the p-value is “low”, then the data are unlikely
according to the null, and we can reject the null hypothesis (i.e., there is a low chance of a type 1 error).
Typically, we set the threshold at 𝛼 = 0.05 → 𝑟𝑒𝑗𝑒𝑐𝑡 𝑛𝑢𝑙𝑙 𝑖𝑓 𝑝 < 0.05. In the lecture, the following
example was given. An online webstore has a new design, and finds that with the new design there is
1.5% conversion, as opposed to the 1% conversion with the old design. Doing a two-tailed test, we find
𝑍 = 2.54 and hence 𝑝 = 0.01. This means that there is a 1% probability of finding this difference in
proportions (0.5%), if in fact there’s no difference (null hypothesis holds). This probability is so small, so
we can confidently reject the null hypothesis in this case.

Exploratory data analysis
It is important to always explore your data before running any model, because in the real world, data
come with all sorts of errors, missing values, etc.

Data visualization is important. It serves multiple purposes. For example, visualizing your data is useful
for exploring your data: you can see if something might be off. Secondly, it is useful in understanding
and making sense of the data. Lastly, data visualization can be used to communicate results.
It is important to choose the right chart type for your data visualization.

The benefits of buying summaries with Stuvia:

Guaranteed quality through customer reviews

Guaranteed quality through customer reviews

Stuvia customers have reviewed more than 700,000 summaries. This how you know that you are buying the best documents.

Quick and easy check-out

Quick and easy check-out

You can quickly pay through credit card or Stuvia-credit for the summaries. There is no membership needed.

Focus on what matters

Focus on what matters

Your fellow students write the study notes themselves, which is why the documents are always reliable and up-to-date. This ensures you quickly get to the core!

Frequently asked questions

What do I get when I buy this document?

You get a PDF, available immediately after your purchase. The purchased document is accessible anytime, anywhere and indefinitely through your profile.

Satisfaction guarantee: how does it work?

Our satisfaction guarantee ensures that you always find a study document that suits you well. You fill out a form, and our customer service team takes care of the rest.

Who am I buying these notes from?

Stuvia is a marketplace, so you are not buying this document from us, but from seller tilburgsamenvattingen. Stuvia facilitates payment to the seller.

Will I be stuck with a subscription?

No, you only buy these notes for $8.13. You're not tied to anything after your purchase.

Can Stuvia be trusted?

4.6 stars on Google & Trustpilot (+1000 reviews)

77254 documents were sold in the last 30 days

Founded in 2010, the go-to place to buy study notes for 14 years now

Start selling
$8.13  1x  sold
  • (0)
  Add to cart