IGCSE Edexcel Economics Microeconomics notes (first half of the Pearson textbook). This can be used for revision for Paper 1 of the Edexcel IGCSE Economics course. Includes diagrams and perfect answers in bullet points (perfect for long-answer questions!)
Complete IGCSE Edexcel Economics Notes:
The Economic Problem is that all countries have finite resources, yet we have
unlimited wants. An economist must decide how to allocate these scarce resources
between uses, weighing up the pros and cons of different situations. The three main
questions which are asked are:
1. What to produce?
2. How to produce?
3. For whom to produce?
When making these choices, firms and governments will face a cost called opportunity cost.
The opportunity cost is a sacrifice made when making a choice. This choice can be
graphed on a chart which shows the different combinations of goods an economy can
produce if all resources are used up, called the Production Possibility Curve (aka PPC). It
is assumed that nations can produce capital goods (those purchased by firms to produce
other goods) and consumer goods (those purchased by households with the intention of
using them). When a point moves along the PPC, an opportunity cost occurs because you
could be producing a different amount of something else and get more of it.
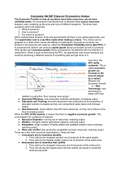
Over time, the
PPC shifts
outwards. This is
called economic
growth (an
increase in the
level of output
by a nation).
Reasons for
Economic Growth
● New
Technology: new
technology is
faster and more
reliable in production, thus causing more output
● Improved Efficiency: new production methods developed, increasing output
● Education and Training: economy becomes more productive as the proportion of
educated workers increases as they can comprehend tasks faster and increase
output
● New Resources: some nations may find more resources, so they can produce more,
thus increasing output
When the PPC shifts inwards, it means that there is negative economic growth. This
could happen for a plethora of reasons:
● Resource Depletion: running out of resources, reducing output
● Weather: droughts reduce agricultural capacity, reducing output
● Emigration: large numbers of highly skilled and qualified workers move overseas,
reducing output
● Wars and conflict: less production availability as fewer resources, reducing output
There are a few main economic assumptions. These are that:
1. Consumers aim to maximise benefits
1. They will buy the cheapest product out of products of the same quality
2. They will buy the highest quality product out of products at the same price
2. Businesses aim to maximise their profits
1. They will buy the cheapest resources out of resources at the same price
2. They will choose the highest price that the market can stand to maximise
revenue and profit
,However, in some situations, consumers and producers might not actually maximise their
benefits:
1. Consumers
1. Difficulty in calculating benefits results in less satisfaction
2. Consumers may develop habits, such as brand loyalty
3. Influenced - consumers may be influenced by people such as friends or
parents and adopt their buying habits
4. If consumers do not have access to all of the information, they cannot make
balanced choices
2. Producers
1. Sales managers may attempt to sell as much as possible individually, thus
selling larger quantities and lowering prices, making profits negative
2. Alternative business objectives such as customer care
3. Enterprises operating as charities do not always want profits
4. Social Enterprises want to help the community, not just gain profit
5. If producers do not have access to all of the information, they cannot make
balanced choices
Demand is the amount of a good which is bought at given prices over periods of time.
Effective demand is how much would be bought at any given price. Demand can be
shown graphically, on the demand curve. This is a line drawn on a graph showing how
much of a good will be bought at different prices. Price and quantity demanded have an
inverse relationship.
If the price of a
good changes,
then there is a
movement along
the demand
curve, and if there
is a change in
other factors
(income, etc) then
the demand curve
will shift. This
means that it
moves inwards or
outwards.
There are some
specific factors
affecting demand:
● Demographic Changes: an example of a demographic change is an ageing
population, where there is an increase in demand for retirement homes and holidays
for the elderly. Other changes include geographical demographics and ethnic
demographics; when these things change, demand for goods increases and falls.
● Advertising: firms may attempt to influence demand for their products through
advertising and other forms of promotion. Heavy advertising results in a shift
outwards
● Income: when disposable income rises, demand for goods rises. When income rises,
demand for normal goods (goods which you spend more money on when you have
access to more money) rises. However, when income rises, demand for inferior
goods (goods which are similar to supermarket ‘own goods’ brands) decreases as
consumers move on to more expensive options
● Fashion and tastes: demand rises for things which are more fashionable and
attractive at the time, however, these tastes change over time
, ● Price of substitutes: a substitute good is a good which is bought as an alternative to
another for the same function. When the price of a substitute decreases, demand for
a product falls (the demand curve shifts leftwards). If there are many substitutes,
demand is changed significantly
● Price of complements: a complementary good is a good which is purchased
together with another good because it is consumed with that other good. If the price
of the complement of a good increases, then the demand for the product may
decrease.
The Supply Curve:
Supply is the amount that producers are willing to offer to sell at different prices in a given
period of time. The supply curve is a line drawn on a graph which shows how much of a
good sellers are willing to supply at given prices. There is a proportionate relationship
between price and quantity supplied. This means that when prices increase, supply
increases and vice versa.
If the price of a good changes, then there will be movement along the supply curve. A
change in other factors (ie the FoP) can result in a shift in the supply curve. This is when it
moves inwards or outwards.
Sometimes, the supply can be fixed. This means that there is a vertical supply curve. An
example of this is when it is impossible for supply to be increased, such as for seats at a
sports venue.
Price is the main factor which can affect supply. These include:
● Production costs - These are things such as machinery costs, wages, raw materials
and rent. If the price is fixed and production costs rise, then sellers will reduce supply
as their profits are reduced, and vice versa. This results in the supply curve shifting
inwards.
● Indirect taxes - These are taxes on spending (ie VAT, GST). When they are imposed,
then the supply curve shifts leftwards because firms have to spend more, thus
reducing supply. Governments will implement these taxes to increase revenue and
discourage the consumption of harmful products. When indirect taxes are increased,
the supply curve shifts inwards and vice versa.
● Subsidies - This is where governments give money to firms in the form of a grant.
This encourages them to produce a particular product, thus increasing supply and
shifting the supply curve outwards.
● Changes in technology - Newer technology can decrease the costs of production by
making it more efficient. This can increase yield (the amount of something produced),
causing the supply curve to shift outwards.
● Natural Factors - These include weather, natural disasters, pests and disease. Good
growing conditions increase crop yield, thus increasing supply and shifting the supply
curve outwards, and vice versa.
The benefits of buying summaries with Stuvia:
Guaranteed quality through customer reviews
Stuvia customers have reviewed more than 700,000 summaries. This how you know that you are buying the best documents.
Quick and easy check-out
You can quickly pay through credit card or Stuvia-credit for the summaries. There is no membership needed.
Focus on what matters
Your fellow students write the study notes themselves, which is why the documents are always reliable and up-to-date. This ensures you quickly get to the core!
Frequently asked questions
What do I get when I buy this document?
You get a PDF, available immediately after your purchase. The purchased document is accessible anytime, anywhere and indefinitely through your profile.
Satisfaction guarantee: how does it work?
Our satisfaction guarantee ensures that you always find a study document that suits you well. You fill out a form, and our customer service team takes care of the rest.
Who am I buying these notes from?
Stuvia is a marketplace, so you are not buying this document from us, but from seller cheryr. Stuvia facilitates payment to the seller.
Will I be stuck with a subscription?
No, you only buy these notes for $4.12. You're not tied to anything after your purchase.