GLOBAL AIR QUALITY
L01: INTRODUCTION, STRUCTURE AND COMPOSITION OF THE ATMOSPHERE
L02: AIR QUALITY AND METEOROLOGY I: GLOBAL CIRCULATION
L03: TROPOSPHERIC CHEMISTRY
L04: STRATOSPHERIC OZONE
L05: THE GREENHOUSE EFFECT
REGIONAL AIR QUALITY
L06: AQ AND METEOROLOGY II: BOUNDARY LAYER METEOROLO...
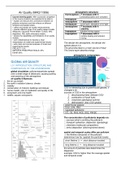
Air Quality (MAQ11306) atmospheric structure:
thermosphere T increases with h
Course learning goals: After successful completion photodissociation and -ionisation
of this course students are expected to be able to: mesopause
• explain and discuss the connections between air mesosphere T decreases with h
pollution emissions and their effects on different
stratopause ozone layer, absorption of UV light
temporal and spatial scales;
• collect and explain air quality measurements; stratosphere T increases with h
• operate different types of air quality related models stability
(Moguntia, Gaussian Plume Model, CLASS, NH3 tropopause turbulent mixing ceases
deposition, NSL traffic emissions model); troposphere T decreases with h
• assess the capabilities and limitations of air quality surface heating and turbulent
models; mixing
• work collaboratively to develop a clear
interpretation of model and experimental results; The denser the atmosphere, the denser the
• write clear and concise analyses of model and
experimental results. sphere above it is
PROJECT: 15% The ground/surface is a main source of heat
REPORTS FROM PRACTICALS: 25% The ozone layer absorbs energy
EXAM: 60%
atmospheric composition:
GLOBAL AIR QUALITY
L01: INTRODUCTION, STRUCTURE AND
COMPOSITION OF THE ATMOSPHERE
global circulation: pollutants/particles spread
over a wide range of distances; causing cooling
and warming of the atmosphere
air quality influences:
1. the air you breath
2. the earth’s radiation balance, climate
3. visibility
4. conservation of (historic) buildings and statues CO2 is interesting due to greenhouse gasses, it
5. human health, cost of medication and quality of life changed a lot
6. ecosystem and crop health sources of CO2 in the atmosphere:
7. wildlife, aquatic ecosystems 1. decomposing trees (release CO2)
2. combustion of fossil fuels
3. volcanoes (geological activity)
4. deforestation (less CO2 uptake)
greenhouse gasses:
CO2, CH4, H2O
regulated pollutants:
CO, O3, NH3, NO2, SO2, PM BC
The concentration of pollutants depends on:
sources (what is emitting the pollutant)
transport (advection, dispersion (spreading))
chemistry (molecular composition)
sinks (deposition (stitching/rained down))
spatial and temporal scales differ per pollutant
-> the lifetime (temporal) of the pollutant
determines how far (spatial) the particle travels:
short lifetime () → short distance traveled
long lifetime () → long distance traveled
the amount of particles also determines the
dispersion
example: CO2 is higher than the average spatial
and temporal scale
, Fin = horizontal flow in (ventilation/airflow in)
Fout = horizontal flow (ventilation/airflow out)
Fv = vertical flow net (exchange with boxes
above and below) (circulation, turbulent)
box model
Air moving in means a higher pressure, that will
force other air out.
determination of the variability of gasses: Relative loss rate = R = 1/t
CH4 CO OH
variability 100 150 10x106 answering learning outcomes
cm-3 I can describe the structure and composition
mean 1870 150 6x106 cm- of the atmosphere
3 I understand the link between relative
relative 5% 100% % variability and lifetime
variability I can formulate a mass balance equation
lifetime 25 y 1y < 1d I understand the application to a box model
𝑑[CH4] / dt = E – k [CH4] ∙ [OH]
𝑑[CO] / dt = E – k [CO] ∙ [OH] L02 AIR QUALITY AND METEOROLOGY I:
variability = the graph length from top to bottom GLOBAL CIRCULATION
relative variability = (variability/mean)*100%
lifetime: how long a gas persists in the global evolution of CO2 concentration:
atmosphere the CO2 concentrations increase interannually.
OH is produced by sunlight 1 concentration in the atmosphere globally,
CH4 is higher at denser populated areas, and however in northern and southern hemisphere
present at high latitudes due to permafrost the concentrations differ, due to making smaller
melting. High elevation means a spread out of boxes of the globe and measure each box, and
CH4 to lower elevations. thus many different concentrations:
From single box model to Eulerian model
relative variability is a good indicator of lifetime
higher relative variability = shorter lifetime (τ) explain seasonal and latitudinal variation:
lower relative variability = longer lifetime (τ) • seasonal variation is due to vegetation (in
summer CO2 concentration in the
atmosphere is lower, due to vegetation
taking it up, emissions are larger in the
northern hemisphere, and these move
slowly to the southern hemisphere)
• northern hemisphere contains most land;
this results in emissions + land ecosystems
scales of atmospheric mixing
◼ molecular diffusion μm – mm
◼ turbulent mixing, eddies mm – 100 m
box model variables:
◼ boundary layer mixing: stability 10 – 1000 m
dm/dt = the mass changing over time =
E = emissions of a gas (out the box) ◼ mesoscale circulations: regional mixing 100 m
D = dispersion of a gas (in the box); CO2 stuck – 100 km
to the surface and it stays there ◼ general circulation: continental and
P = chemical production (of pollutants -> interhemispheric mixing > 1000 km (monsoon)
chemical reactions cause a increase in
pollutant) The degree of mixing a pollutant depends on its
L = chemical loss (of pollutants -> chemical residence time in the atmosphere (there must
reactions cause a decrease in pollutant) be enough time to be able to mix)
,Residence time depends on chemical stability, (west). Against the rotation of the axis. It will
and deposition rates (climate zone!) never reach the equator, and thus the northern
half will (little to) not mix with the air of the
general circulation: southern half.
The land surface is heated by the sun (equator Ferrel cell
has the most sun, and north and south pole The rotation causes the movement of the airflow
have the least sun) to bend a bit. Due to the movement towards the
At the equator, the air column will expand due to poles, the radius decreases and the velocity
heat (rising). And at the poles, the air column increases, which causes the bend to the right.
will shrink. So the pressure level will change to a
more oval form: Air flow influencing the vegetation
Expanding air Cloud formation (condensation) at the equator,
column: high due to uprising heat/air. Afterwards it rains
pressure system (locally called the tropics). Dry air moves in the
(pressure direction of the poles, that is why there are
increases) desserts.
Declining air
column: pressure Static earth Rotating earth
decreases (low Air flows only towards Air flows towards the
pressure system) the equator left/right due to the
‘’Coriolis Earth’’
Air moves to the poles because there is a lower 1 cell 3 cells:
pressure, mass moves to the poles, so the mass 1 Hadley cell
will eventually decrease at the equator and 2 Ferrel cell
increase at the poles. This results to high 3 polar cell
pressure at the poles and low pressure at the One pressure field Several pressure
equator. Then the mass will move back to the fields depending on
equator, due to pressure differences. This the type of cell
process repeats, this is the circulation.
Pressures vary at the equator and poles.
Pressure depends on the air column above it.
Airflow near the surface:
It rotates to the east(right)
Air close to the axis at the poles moves faster
because the earth has a small radiance there;
air close to the equator moves slower because
the earth has a large radiance there.
(ballerinamodel)
concluding this means that continents and trade
Following the law: (v * r = constant) winds influence the airflow; in c) you can see
At the poles faster airflow due to small radius that the air streams are flowy
At the equator slower airflow due to large radius
In summer and winter there is a difference in:
Hadley cell ITCZ: intertropical convergence zone: a belt of
And due to the rotation, the wind in the Hadley low pressure that circles the Earth generally
cell does not move vertically, but to the left near the equator where the trade winds of the
Northern and Southern Hemispheres come
together
pressure gradient: describes 1) in which
direction and 2|) at what rate the pressure
increases the most rapidly around a particular
location (Pa/m)
jet streams
, jet stream: meandering strong winds in the Due to the rotation of the Earth, air does not
troposphere that blow from west to east (due to flow directly from high to low pressure
the rotation of earth); they form when warm air • it circles clockwise around high pressure
meets cold air; warm air rises and cold air areas (NH)
descends, this causes an air current; jet streams • it circles anti-clockwise around low
can affect the weather by influencing T and pressure areas (NH)
precipitation or taking • the other way around on the SH
it with them
(depending on the NH SH
distance to the jet Winds go clockwise Winds go anti-
stream) outwards from HP to clockwise from HP to
-> in winter T LP LP
differences are Winds go anti- Winds go clockwise
extremer, so jet clockwise from LP to from LP to HP
streams are faster HP
then
Pollution transport is determined by the direction
and speed of the airflow.
The air eventually will move to the sites from
high to low pressure (situation 1)
The air eventually will move to the center
from high to low pressure (situation 2)
The Ferrel cell causes the meandering of wind.
It takes a lot of time to move the CO2 towards
At the places where air is rising there are the other hemisphere.
forests and low pressure -> wet deposition
and cleaning of the atmosphere Due to rotation forces the air moves faster at the
At the places where air is descending there are poles and slower at the equator. From the view
desserts and high pressure -> dust storms at the poles at the NH the wind moves to the
right and from the view at the poles at the SH
Typical timescales for global horizontal the wind moves to the left (Q5, L02)
transport in the troposphere.
Weather is associated with HP/LP
converging air and LP:
upwelling↑ of air: rain
-> pollutants are mixed
over deep layer, wet
deposition
diverging air and HP: subsidence↓ of air: sun
No sharp boundary between the Hadley and -> pollutants are confined to a shallow layer
Ferrel cell, so exchange of air (1-2 months).
However at the equator, the airflow collides and answering learning outcomes
rises up and then moves back to the direction of I understand the basics of how the global
the poles (the same hemisphere), so exchange atmosphere is overturned
of airflow between the two hemispheres is I understand how air pollution is transported
minimal (1 year) globally
Airflow in the direction of the rotation has a I know the timescales of global mixing
duration of 2 weeks. And due to rotation has a I can describe the wind direction around H
bend to the poles and L pressure systems
The benefits of buying summaries with Stuvia:
Guaranteed quality through customer reviews
Stuvia customers have reviewed more than 700,000 summaries. This how you know that you are buying the best documents.
Quick and easy check-out
You can quickly pay through credit card or Stuvia-credit for the summaries. There is no membership needed.
Focus on what matters
Your fellow students write the study notes themselves, which is why the documents are always reliable and up-to-date. This ensures you quickly get to the core!
Frequently asked questions
What do I get when I buy this document?
You get a PDF, available immediately after your purchase. The purchased document is accessible anytime, anywhere and indefinitely through your profile.
Satisfaction guarantee: how does it work?
Our satisfaction guarantee ensures that you always find a study document that suits you well. You fill out a form, and our customer service team takes care of the rest.
Who am I buying these notes from?
Stuvia is a marketplace, so you are not buying this document from us, but from seller annikahakkers. Stuvia facilitates payment to the seller.
Will I be stuck with a subscription?
No, you only buy these notes for $8.39. You're not tied to anything after your purchase.