I have done ALL the practicals twice in SPSS so that I could get used to the questions.
The exam questions we have got were similar to the ones we used in the practicals but obviously with
different data.
Good luck!
It is really important that you practice, practice, practice in SPSS!
In this SPSS computer practical you will be guided step-by-step through the procedures. After this,
you will work on assignments during which the newly acquired knowledge can be applied. It is
recommended to work with syntax. This will ensure careful documentation of the actions taken (e.g.
create one syntax file with the syntaxes of all assignments). Moreover, during this computer practical
it will become increasingly clear why syntax can be very useful.
PRACTICAL 6 – Continuous and dichotomous outcomes recap
ANALYSIS OF CONTINUOUS OUTCOME VARIABLES
1.1 Independent t-test
In the previous course, we already learned to analyse continuous outcome measures by using t-tests. For
instance, we examined whether two groups had different means on a continuous variable, using an
independent t-test. We will run this test once again to refresh our knowledge. To do this, open the file
sbp_qas.sav. This file contains the following data of 32 subjects: systolic blood pressure ( sbp, in
mmHg), body mass index (bmi = weight / height2, weight in kg, height in m), age (age, in years) and
smoking (smk; 0=no, 1=yes). Compare the mean systolic blood pressure between smokers and non-
smokers, using an independent t-test
Analyze >>> Compare Means >>> Independent-Samples T Test >>> Test Variables: Outcome
(systolic blood pressure) >>> Grouping variables: how are groups split here: smoking (>>> define
groups: recode to 0 and 1 if needed)
Computer practical 1 1
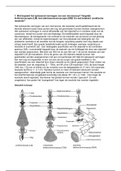
,** independent t-test for the difference in sbp between smokers/non-smokers
T-TEST GROUPS=smk(0 1)
/MISSING=ANALYSIS
/VARIABLES=sbp
/ES DISPLAY(TRUE)
/CRITERIA=CI(.95).
The disadvantage of the independent t-test is the fact that we are not able to account for possible
confounders and effect modifiers. Furthermore, with the independent t-test we can only compare 2
groups with respect to the continuous outcome variable, whereas we might like to compare multiple
groups, or even examine the association with a continuous determinant. All of this is possible with
regression analysis.
1.2 Scatterplot
With the procedure Scatter we can create scatterplots. A scatterplot visualizes the relationship between
two continuous variables graphically. In addition, it can indicate the calculated regression line.
You may be familiar with the following rule of thumb : “Blood pressure = 100 + age in years”. Let’s
see whether we can indeed predict someone’s (systolic) blood pressure by the variable ‘age’. The file
sbp_age.sav contains the systolic blood pressure (sbp, in mmHg) and age (age, in years) of 30 persons.
We will now make a scatterplot with age on the X-axis and sbp on the Y-axis.
Graphs>>> Legacy Dialogs>>> Scatter/Dot >>>Simple scatter >>> X: age, Y: systolic blood
pressure >>> Title: name the graph
Computer practical 1 2
,** Scatterplot for age and blood pressure
GRAPH
/SCATTERPLOT(BIVAR)=age WITH sbp
/MISSING=LISTWISE
/TITLE='RElationship between the age and the systolic blood pressure'.
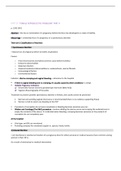
By eyeballing, there seems to be a reasonably linear association between both variables. You can
imagine a straight line through the scatterplot. However, there also seems to be one ‘outlier’. Now that
we have established that we can reasonably assume a linear association between age and sbp, we will
examine this relationship further with regression analysis.
1.3 Linear regression analysis
Computer practical 1 3
, Now we will use the file sbp_age.sav. We are going to create a regression equation with age as
independent variable and sbp as dependent variable (after all, we assume that blood pressure depends
on age, not the other way around).
Analyze>>> Regression>>> Linear >>> dependent: systolic blood pressure, independent: age
** Association between age and blood pressure
REGRESSION
/MISSING LISTWISE
/STATISTICS COEFF OUTS R ANOVA
/CRITERIA=PIN(.05) POUT(.10)
/NOORIGIN
/DEPENDENT sbp
/METHOD=ENTER age.
(different than in answers >>> probably the data has been changed)
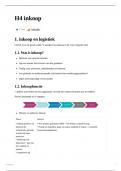
The first table that appears in the output (Variables Entered/Removed) indicates which variables were
included in the model. Here we have only one variable (age) and therefore only one model. The word
Enter in the Method column refers to the selection method of the variables (not important here)
Computer practical 1 4
The exam questions we have got were similar to the ones we used in the practicals but obviously with
different data.
Good luck!
It is really important that you practice, practice, practice in SPSS!
In this SPSS computer practical you will be guided step-by-step through the procedures. After this,
you will work on assignments during which the newly acquired knowledge can be applied. It is
recommended to work with syntax. This will ensure careful documentation of the actions taken (e.g.
create one syntax file with the syntaxes of all assignments). Moreover, during this computer practical
it will become increasingly clear why syntax can be very useful.
PRACTICAL 6 – Continuous and dichotomous outcomes recap
ANALYSIS OF CONTINUOUS OUTCOME VARIABLES
1.1 Independent t-test
In the previous course, we already learned to analyse continuous outcome measures by using t-tests. For
instance, we examined whether two groups had different means on a continuous variable, using an
independent t-test. We will run this test once again to refresh our knowledge. To do this, open the file
sbp_qas.sav. This file contains the following data of 32 subjects: systolic blood pressure ( sbp, in
mmHg), body mass index (bmi = weight / height2, weight in kg, height in m), age (age, in years) and
smoking (smk; 0=no, 1=yes). Compare the mean systolic blood pressure between smokers and non-
smokers, using an independent t-test
Analyze >>> Compare Means >>> Independent-Samples T Test >>> Test Variables: Outcome
(systolic blood pressure) >>> Grouping variables: how are groups split here: smoking (>>> define
groups: recode to 0 and 1 if needed)
Computer practical 1 1
,** independent t-test for the difference in sbp between smokers/non-smokers
T-TEST GROUPS=smk(0 1)
/MISSING=ANALYSIS
/VARIABLES=sbp
/ES DISPLAY(TRUE)
/CRITERIA=CI(.95).
The disadvantage of the independent t-test is the fact that we are not able to account for possible
confounders and effect modifiers. Furthermore, with the independent t-test we can only compare 2
groups with respect to the continuous outcome variable, whereas we might like to compare multiple
groups, or even examine the association with a continuous determinant. All of this is possible with
regression analysis.
1.2 Scatterplot
With the procedure Scatter we can create scatterplots. A scatterplot visualizes the relationship between
two continuous variables graphically. In addition, it can indicate the calculated regression line.
You may be familiar with the following rule of thumb : “Blood pressure = 100 + age in years”. Let’s
see whether we can indeed predict someone’s (systolic) blood pressure by the variable ‘age’. The file
sbp_age.sav contains the systolic blood pressure (sbp, in mmHg) and age (age, in years) of 30 persons.
We will now make a scatterplot with age on the X-axis and sbp on the Y-axis.
Graphs>>> Legacy Dialogs>>> Scatter/Dot >>>Simple scatter >>> X: age, Y: systolic blood
pressure >>> Title: name the graph
Computer practical 1 2
,** Scatterplot for age and blood pressure
GRAPH
/SCATTERPLOT(BIVAR)=age WITH sbp
/MISSING=LISTWISE
/TITLE='RElationship between the age and the systolic blood pressure'.
By eyeballing, there seems to be a reasonably linear association between both variables. You can
imagine a straight line through the scatterplot. However, there also seems to be one ‘outlier’. Now that
we have established that we can reasonably assume a linear association between age and sbp, we will
examine this relationship further with regression analysis.
1.3 Linear regression analysis
Computer practical 1 3
, Now we will use the file sbp_age.sav. We are going to create a regression equation with age as
independent variable and sbp as dependent variable (after all, we assume that blood pressure depends
on age, not the other way around).
Analyze>>> Regression>>> Linear >>> dependent: systolic blood pressure, independent: age
** Association between age and blood pressure
REGRESSION
/MISSING LISTWISE
/STATISTICS COEFF OUTS R ANOVA
/CRITERIA=PIN(.05) POUT(.10)
/NOORIGIN
/DEPENDENT sbp
/METHOD=ENTER age.
(different than in answers >>> probably the data has been changed)
The first table that appears in the output (Variables Entered/Removed) indicates which variables were
included in the model. Here we have only one variable (age) and therefore only one model. The word
Enter in the Method column refers to the selection method of the variables (not important here)
Computer practical 1 4