Samenvatting Stappenplan voor de analyses in SPSS voor VOS
11 views 0 purchase
Course
Verdieping in Onderzoeksmethoden en Statistiek
Institution
Universiteit Utrecht (UU)
Book
Discovering Statistics Using IBM SPSS
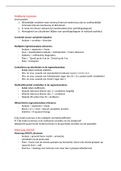
Een stappenplan voor de uitvoering van iedere analyse in SPSS. Per onderwerp uitgelegd welke stappen ondernomen moeten worden en welke informatie waar te vinden is.
Exam Guide for Applied Multivariate Data Analysis – Get yourself a Wonderful Grade!
Summary of Statistics (IBC), Radboud University
Answers assignment 3 business research methods
All for this textbook (117)
Written for
Universiteit Utrecht (UU)
Algemene Sociale Wetenschappen
Verdieping in Onderzoeksmethoden en Statistiek
All documents for this subject (3)
Seller
Follow
lauravdgaag
Reviews received
Content preview
Multipele regressie
Voorwaarden:
1. Afhankelijke variabele moet minimaal interval meetniveau zijn en onafhankelijke
minimaal interval meetniveau of dichotoom.
2. Er moet een lineair verband zijn (onderzoeken door spreidingsdiagram)
3. Afwezigheid van uitschieters (kijken naar spreidingsdiagram of residuals statistics)
Correlatie tussen variabelen bepalen:
- Analyze > correlate > bivariate
Multipele regressieanalyse uitvoeren:
- Analyze > regression > linear
- Save > standardized residuals > Mahalanobis > Cook’s distances
- Statistics > collineairity diagnostics
- Plots > *Zpred op de X-as en *Zresid op de Y-as
- Plots > histogram
Controleren op uitschieters in de regressieanalyse:
- Bekijk tabel residuals statistics
- Min. en max. waarde van standardized residuals: tussen -3,3 en +3,3
- Min. en max. waarde van Mahalanobis: lager dan 10 + (2 x aantal onafh. Variabelen)
- Min. en max. waarde van Cook’s: lager dan 1
Multicollineariteit vaststellen in de regressieanalyse:
- Bekijk tabel coefficients
- Waarde tolerance kleiner dan .2 > probleem mogelijk
- Waarde tolerance kleiner dan .1 > probleem
- Waarde VIF groter dan 10 > probleem
Hiërarchische regressieanalyse uitvoeren:
- Analyze > regression > linear
- Block 1 of 1 > next > nieuwe variabelen invullen
- Statistics > R squared change
R bij model summary is de multipele correlatiecoëfficiënt
R^2 bij model summary is de verklaarde variantie van de steekproef
Adjusted R square bij de model summary is de geschatte variantie van de populatie
Meerweg ANOVA
Meerweg ANOVA uitvoeren:
- Analyze > general linear model > univariate
- Variabelen op de juiste plek
- Plots > factor met de meeste groepen op horizontal, factor met minste groepen op
seperate lines > add
- Post hoc > toetsing voor factoren met meer dan 2 groepen (Bonferroni)
The benefits of buying summaries with Stuvia:
Guaranteed quality through customer reviews
Stuvia customers have reviewed more than 700,000 summaries. This how you know that you are buying the best documents.
Quick and easy check-out
You can quickly pay through credit card or Stuvia-credit for the summaries. There is no membership needed.
Focus on what matters
Your fellow students write the study notes themselves, which is why the documents are always reliable and up-to-date. This ensures you quickly get to the core!
Frequently asked questions
What do I get when I buy this document?
You get a PDF, available immediately after your purchase. The purchased document is accessible anytime, anywhere and indefinitely through your profile.
Satisfaction guarantee: how does it work?
Our satisfaction guarantee ensures that you always find a study document that suits you well. You fill out a form, and our customer service team takes care of the rest.
Who am I buying these notes from?
Stuvia is a marketplace, so you are not buying this document from us, but from seller lauravdgaag. Stuvia facilitates payment to the seller.
Will I be stuck with a subscription?
No, you only buy these notes for $5.75. You're not tied to anything after your purchase.