October/ November 2022
IOP2601 Examination Memo
Organisational Research Methodology
QUESTION ANSWERS
NUMBER
QUESTION 1
1.1. Descriptive statistics refers to the technique where the data is organized, summarized
and described. This is a descriptive research approach.
Whilst inferential statistics refers to a technique that is applied to samples in order to
make inferences about the populations. It is an experimental research approach.
1.2. The independent variable is the time spent in front of the screen (screen time) because
it is a variable that is controlled by the experimenter or the researcher.
QUESTION 2
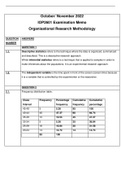
2.1. Frequency distribution table:
Class Frequency Percentage Cumulative Cumulative
Interval frequency frequency percentage
45-49 5 5.26 95 100
40-44 45 47.37 90 94.74
35-39 10 10.53 45 47.37
30-34 5 5.26 35 36.84
25-29 16 16.84 30 31.58
20-24 14 14.74 14 14.74
95 100
, 2.2. The data given in the table is grouped data because it is continuous data and it is often
displayed in frequency distribution tables and histograms. From the frequency distribution
table, we can see that grouped data also uses class intervals of a real lower limit and a
real upper limit.
2.3. There are 95 students involved in the study. The class interval is 5
2.4. A qualitative study is more useful to the professor because it is known to be an efficient
way of communicating numbers and information. It is part of a powerful and well-designed
disciplinary language. It also allows for the re-modelling and approximation of real world
phenomena.
QUESTION 3
3.1. The relationship between excessive sleep and mood:
NΣXY − ΣXΣY
r=
√[NΣX 2 − (ΣX)2 ][NΣY 2 − (ΣY)2 ]
10(190) − (47)(44)
r=
√[10(301) − (47)2 ][10(236) − (44)2 ]
1900 − 2068
r=
√[3010 − 2209][2360 − 1936]
−168
r=
√339624
−168
r=
582,772683
r= -0.288277067= -0.29
3.2. Correlation coefficient, r= -0.29 therefore it is a weak negative correlation
IOP2601 Examination Memo
Organisational Research Methodology
QUESTION ANSWERS
NUMBER
QUESTION 1
1.1. Descriptive statistics refers to the technique where the data is organized, summarized
and described. This is a descriptive research approach.
Whilst inferential statistics refers to a technique that is applied to samples in order to
make inferences about the populations. It is an experimental research approach.
1.2. The independent variable is the time spent in front of the screen (screen time) because
it is a variable that is controlled by the experimenter or the researcher.
QUESTION 2
2.1. Frequency distribution table:
Class Frequency Percentage Cumulative Cumulative
Interval frequency frequency percentage
45-49 5 5.26 95 100
40-44 45 47.37 90 94.74
35-39 10 10.53 45 47.37
30-34 5 5.26 35 36.84
25-29 16 16.84 30 31.58
20-24 14 14.74 14 14.74
95 100
, 2.2. The data given in the table is grouped data because it is continuous data and it is often
displayed in frequency distribution tables and histograms. From the frequency distribution
table, we can see that grouped data also uses class intervals of a real lower limit and a
real upper limit.
2.3. There are 95 students involved in the study. The class interval is 5
2.4. A qualitative study is more useful to the professor because it is known to be an efficient
way of communicating numbers and information. It is part of a powerful and well-designed
disciplinary language. It also allows for the re-modelling and approximation of real world
phenomena.
QUESTION 3
3.1. The relationship between excessive sleep and mood:
NΣXY − ΣXΣY
r=
√[NΣX 2 − (ΣX)2 ][NΣY 2 − (ΣY)2 ]
10(190) − (47)(44)
r=
√[10(301) − (47)2 ][10(236) − (44)2 ]
1900 − 2068
r=
√[3010 − 2209][2360 − 1936]
−168
r=
√339624
−168
r=
582,772683
r= -0.288277067= -0.29
3.2. Correlation coefficient, r= -0.29 therefore it is a weak negative correlation