STA1610 Exam Prep
Study Unit 1 – 3
Questions & Answers
,Study Goals:
• Study Unit 01: Data and Statistics
• Study Unit 02: Descriptive Statistics: Tabular and Graphical
Presentations
• Study Unit 03: Descriptive Statistics: Numerical measures
• Once you have studied the summary notes for Study Unit 1 – 3
Complete the Exam Prep Day 1 Exercises.
Let’s Get Started!
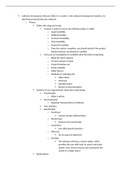
, Some Important Outcomes of Study Units 1, 2 & 3
• Understand key terms and basic concepts of statistics
• Understand the types of variables and their levels of measurement
• Calculate questions related to Frequency Tables (including calculating class width, relative & percent
frequency)
• Understand Stem and Leaf Diagrams
• Calculate Measures of Central Tendency (Mean, Median, Mode)
• Calculate Quartiles
• Calculate Measures of Variation (Range, Variation, Standard Deviation, Coefficient of Variation, Interqu
Range)
• Distributional Shape (using mean & median to check if data is Left Skewed, Symmetrical or Right Skew
• Calculate questions using empirical rule (bell-shaped distribution)
• Calculate upper and lower limits
• Construct 5 Number Summary & Box Plots (Smallest value, Q1, Median (Q2), Q3, Largest value)
Study Unit 1 – 3
Questions & Answers
,Study Goals:
• Study Unit 01: Data and Statistics
• Study Unit 02: Descriptive Statistics: Tabular and Graphical
Presentations
• Study Unit 03: Descriptive Statistics: Numerical measures
• Once you have studied the summary notes for Study Unit 1 – 3
Complete the Exam Prep Day 1 Exercises.
Let’s Get Started!
, Some Important Outcomes of Study Units 1, 2 & 3
• Understand key terms and basic concepts of statistics
• Understand the types of variables and their levels of measurement
• Calculate questions related to Frequency Tables (including calculating class width, relative & percent
frequency)
• Understand Stem and Leaf Diagrams
• Calculate Measures of Central Tendency (Mean, Median, Mode)
• Calculate Quartiles
• Calculate Measures of Variation (Range, Variation, Standard Deviation, Coefficient of Variation, Interqu
Range)
• Distributional Shape (using mean & median to check if data is Left Skewed, Symmetrical or Right Skew
• Calculate questions using empirical rule (bell-shaped distribution)
• Calculate upper and lower limits
• Construct 5 Number Summary & Box Plots (Smallest value, Q1, Median (Q2), Q3, Largest value)