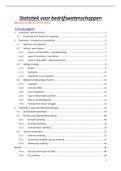
Dit document bevat volledige en duidelijke notities van alle lessen van het vak Statistiek voor Bedrijfswetenschappen van het Schakeljaar Handelswetenschappen gegeven door Patrick Wessa in KULeuven Antwerpen. Ik behaalde op mijn examen in januari 2023 (eerste examenkans) 12/20
, 4.3.21 cronbach alpha ........................................................................................................... 105
4.4 kwantitatieve gegevens met tijdsdimensie/ tijdreeksen .................................................... 106
4.4.1 Equi-distante tijdreeksen ............................................................................................ 106
4.4.2 time series plot (run sequence plot ............................................................................ 107
4.4.3 mean plot ................................................................................................................... 107
4.4.4 blocked bootstrap plot (central tendency) ................................................................. 110
4.4.5 standaard deviation-mean plot .................................................................................. 111
4.4.6 Variatie reduction matrix ............................................................................................ 112
4.4.7 (partiële) autocorrelatie functie ................................................................................. 113
4.4.8 Periodogram en cumulatief periodogram .................................................................. 114
5 hoofdstuk 5: Hypothese testen .................................................................................................. 120
5.1 the central limit theorem ................................................................................................... 121
5.2 Statistische toets van het populatiegemiddelde met bekende variantie (veronderstelling)
121
5.2.1 voorbeeld: Statistische hypothese: Testen van het gemiddelde met bekende variantie -
Voorbeeld 1: Kritische waarde (Regio) ....................................................................................... 124
5.2.2 Voorbeeld: Statistische hypothese: Testen van het gemiddelde met bekende variantie -
Voorbeeld 2: P-waarde (waarschijnlijkheid ................................................................................ 124
5.3 Hypothesetests voor onderzoeksdoeleinden ..................................................................... 125
5.3.1 één steekproef t-Test/ one sample t-test ................................................................... 125
5.3.2 Skewness & kurtosis test ............................................................................................ 129
5.3.3 Gepaarde twee-steekproef t-Test............................................................................... 131
5.3.4 WILCOXON SIGNED-rank test ..................................................................................... 133
5.3.5 unpaird two sample t-test .......................................................................................... 134
5.3.6 unpaired two sample welch test ................................................................................. 137
5.3.7 mann-whitney u test (wilcoxon rank-sum test) .......................................................... 138
5.3.8 bayesian two sample test ........................................................................................... 139
5.3.9 Chi-squared tests for count data ................................................................................ 139
5.3.10 one way analysis of variance (1-way anova) ............................................................... 142
5.3.11 two way analysis of variance (2-way anova) .............................................................. 144
6 hoofdstuk 6: regressie modellen ................................................................................................ 148
6.1 Eenvoudig lineair regressiemodel (SLRM) .......................................................................... 148
6.2 Meervoudig lineair regressiemodel (MLRM) ...................................................................... 150
6.3 Hypothesetests met lineaire regressiemodellen (vanuit praktisch perspectief) ................. 151
7 Inleiding tot de analyse van tijdreeksen ..................................................................................... 156
7.1 Case: markt van gezondheids- en persoonlijke verzorgingsproducten (HPC) ..................... 156
7.2 decompositie van een tijdreeks .......................................................................................... 156
3
, 7.2.1 Klassieke decompositie van tijdreeksen door geleidende gemiddelden..................... 156
7.2.2 Seizoensgebonden decompositie van tijdreeksen door loess..................................... 158
7.2.3 Decompositie door structurele tijdreeksmodellen ..................................................... 158
7.3 Ad hoc voorspelling van tijdreeksen ................................................................................... 159
7.3.1 Regressieanalyse van tijdreeksen ............................................................................... 160
7.3.2 Afvlakmodellen/ Smoothing Models .......................................................................... 163
8 hoofdstuk 8: Univariate box-jenkins analyse .............................................................................. 166
8.1 data .................................................................................................................................... 167
8.2 theoretische concepten ...................................................................................................... 168
8.2.1 stationair proces ......................................................................................................... 168
8.2.2 white noice ................................................................................................................. 168
8.3 stationariteit ....................................................................................................................... 168
8.3.1 stationariteit in het gemiddelde ................................................................................. 168
8.3.2 Stationariteit in de variantie ....................................................................................... 169
4
The benefits of buying summaries with Stuvia:
Guaranteed quality through customer reviews
Stuvia customers have reviewed more than 700,000 summaries. This how you know that you are buying the best documents.
Quick and easy check-out
You can quickly pay through credit card or Stuvia-credit for the summaries. There is no membership needed.
Focus on what matters
Your fellow students write the study notes themselves, which is why the documents are always reliable and up-to-date. This ensures you quickly get to the core!
Frequently asked questions
What do I get when I buy this document?
You get a PDF, available immediately after your purchase. The purchased document is accessible anytime, anywhere and indefinitely through your profile.
Satisfaction guarantee: how does it work?
Our satisfaction guarantee ensures that you always find a study document that suits you well. You fill out a form, and our customer service team takes care of the rest.
Who am I buying these notes from?
Stuvia is a marketplace, so you are not buying this document from us, but from seller diedevdm. Stuvia facilitates payment to the seller.
Will I be stuck with a subscription?
No, you only buy these notes for $13.42. You're not tied to anything after your purchase.