FIXED INCOME SECURITIES – TERM STRUCTURE OF INTEREST RATES
(CH 15)
WHAT IS THE TSI?
TSI → relationship between the yields to maturity and term to maturity of a sample of
similar bonds.
Similar bonds
- should have similar characteristics → pure relationship
- must be similar → risk, liquidity, tax rates, coupon rates, credit quality
- doesn’t need to be similar → time to maturity
Shows how bond yields change with time to maturity
- time factor = time premium/time spread/price of time
Importance of the TSI
Used to extract spot rates which are applied in:
- pricing bonds
- extracting forward rates
▪ predict future interest rates & use them to formulate active bond strategies
- predicating future economic activity
- making investment decisions
- other uses (i.e. estimating inflation, monetary policies)
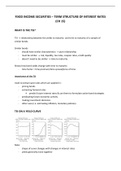
TSI ON A YIELD CURVE
Note:
- shape of curve changes with changes in interest rates
- yields generally move together
, - shape of curve is NB to investors & economists
Flat yield curve → investors want the same return for all instruments.
Upward-sloping yield curve → investors want higher return for long-term instruments &
lower return for short-term instruments.
Downward-sloping yield curve → investors want a higher return for short-term instruments
and a lower-return for long-term instruments.
Hump-shaped yield curve → investors want a lower return for short & long-term
instruments and a higher return for medium-term instruments.
Example 1:
You are given the following hypothetical term structure of interest rates based on zero
coupon treasury bonds each with a face value of R1 000.
Term to maturity (years) Yield Price (R)
1 5% 952.38
2 6% 890
3 7% 916.30
4 8% 735.03
- this is a pure curve, made of ZCB bonds, issued by the government
- the YTM for ZCBs are called spot rates
▪ TSI or spot rate curve or the pure curve
DERIVING SPOT RATES
DIRECT OBSERVATION METHOD
- works if given a pure yield curve, made of stripped treasury zero-coupon bonds
- YTM of a ZCB is the spot rate
- observe bond yields in the TSI → those are your spot rates
If given the prices & face values of ZCBs, use the following formula to calculate the spot
rate:
𝐹𝑉
𝑃𝐵 =
(1 + 𝑟)𝑛

