APUNTES STATS FINAL
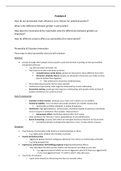
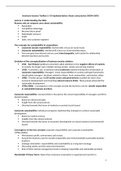
1. Types of Variables – Python
2. Python Libraries
The most important libraries we will use during this course are:
• numpy (np): for high-level mathematical functions/numerical analysis
• scipy.stats (ss): for probability distributions
• pandas (pd): for data structuring and manipulation
• matplotlib.pyplot (plt): for plots
3. Pandas
Some useful functions to always remember:
• describe(): summary statistics for each column of the dataset
• head(): print the first 5 rows of the data set
• tail(): print the last 5 rows of the dataset
• dtypes: type of variable in each column
• shape: number of rows and columns
, 4. Manipulation with Pandas
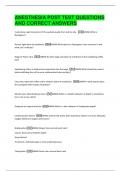
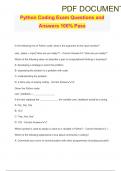
Filter rows (slicing), example: assume we want to select only students with age
between 30 and 33 included.
Create a new column, example: assume we want to add a new column, recording the
gender of students. Here you can see the gender of the 3 students: male, female, male
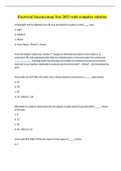
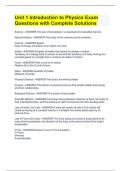
We want to assign a letter grade to students, with the following rule:
• gpa >= 8 letter grade A
• 6 <= gpa<8 letter grade B
• gpa < 6 letter C
, Sort columns, example: assume we want to sort the data frame with respect to the value
of a given column. We want to get the data frame sorted with respect to the gpa, in
decreasing order:
5. Graphs
We can describe categorical variables using frequency distribution tables and graphs
such as bar charts, pie charts and histograms.
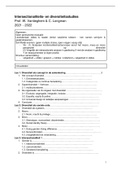
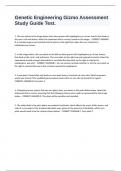
FREQUENCY DISTRIBUTION TABLE
A frequency distribution is a table used to organize data. The left column (called
classes) includes all possible responses to a variable being studied. The right column is
a list of the frequencies (number of observations of each class);
A cumulative frequency distribution contains the total number of observations whose
values are less than the upper limit for each class. It is used to determine the number of
observations that lie above (or below) a particular value;
A relative/percentage frequency distribution is obtained by dividing each frequency
by the total number of observations (n). It can be expressed as a percentage;
A relative/percentage cumulative frequency distribution is the quotient between the
cumulative frequency of a particular value and the total number of observations (n). It
can be expressed as a percentage.
1. Types of Variables – Python
2. Python Libraries
The most important libraries we will use during this course are:
• numpy (np): for high-level mathematical functions/numerical analysis
• scipy.stats (ss): for probability distributions
• pandas (pd): for data structuring and manipulation
• matplotlib.pyplot (plt): for plots
3. Pandas
Some useful functions to always remember:
• describe(): summary statistics for each column of the dataset
• head(): print the first 5 rows of the data set
• tail(): print the last 5 rows of the dataset
• dtypes: type of variable in each column
• shape: number of rows and columns
, 4. Manipulation with Pandas
Filter rows (slicing), example: assume we want to select only students with age
between 30 and 33 included.
Create a new column, example: assume we want to add a new column, recording the
gender of students. Here you can see the gender of the 3 students: male, female, male
We want to assign a letter grade to students, with the following rule:
• gpa >= 8 letter grade A
• 6 <= gpa<8 letter grade B
• gpa < 6 letter C
, Sort columns, example: assume we want to sort the data frame with respect to the value
of a given column. We want to get the data frame sorted with respect to the gpa, in
decreasing order:
5. Graphs
We can describe categorical variables using frequency distribution tables and graphs
such as bar charts, pie charts and histograms.
FREQUENCY DISTRIBUTION TABLE
A frequency distribution is a table used to organize data. The left column (called
classes) includes all possible responses to a variable being studied. The right column is
a list of the frequencies (number of observations of each class);
A cumulative frequency distribution contains the total number of observations whose
values are less than the upper limit for each class. It is used to determine the number of
observations that lie above (or below) a particular value;
A relative/percentage frequency distribution is obtained by dividing each frequency
by the total number of observations (n). It can be expressed as a percentage;
A relative/percentage cumulative frequency distribution is the quotient between the
cumulative frequency of a particular value and the total number of observations (n). It
can be expressed as a percentage.