Exam (elaborations)
Building_Layered_Visualizations_VisualAnalytics_Week6_NEC_Solved
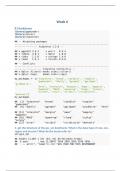
1. get the structure of the gss_sm dataframe. What is the data type of race, sex, region and income? What do the levels refer to? 2. create a graph that shows a count of religious preferences grouped by region 3. turn the region counts in percentages 4. use dodge2() to put the religious affilia...
[Show more]