100% satisfaction guarantee Immediately available after payment Both online and in PDF No strings attached
logo-home
Examenvragen Research and Analytics 2e jaar $10.20
Add to cart

Exam (elaborations)

Examenvragen Research and Analytics 2e jaar

 8 views  0 purchase
  • Course
  • Institution

Tentamen van 2 pagina's voor het vak Research & Analytics aan de KdG

Preview 1 out of 2  pages

  • May 11, 2023
  • 2
  • 2021/2022
  • Exam (elaborations)
  • Questions & answers
avatar-seller
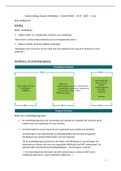
Wat is het verschil tussen nauwkeurigheid en betrouwbaarheid?

De foutmarge geeft de nauwkeurigheid weer. Het geeft de afstand weer tussen de grenzen en het
steekproefgemiddelde.

Het betrouwbaarheidsinterval zegt tussen welke minimum- en maximumgrens het
populatiegemiddelde ligt.

Teken de betrouwbaarheid.

 Normale verdeling tekenen en de grenzen aanduiden van de Z-waarden.

Was dit relevant voor ons onderzoek? Zo ja, waarom?

Ja, hiermee wordt de chikwadraattoets berekent.

Hoe hebben we dit berekent?

de betrouwbaarheid voor een kwanti onderzoek is meestal 95%.


Wat is representativiteit?

Als een steekproef representatief is, mogen we hem extrapoleren en uitspraken doen over de
populatie.

Hoe kan men dit toetsen?

Met de chikwadraattoets.

Was ons onderzoek representatief?

Nee

Hoe hebben wij dat getoetst?

We hebben dit afzonderlijk gecontroleerd voor geslacht, leeftijd en woonplaats (provincie Antwerpen
versus de gemeenten in Oost-Vlaanderen). We zouden drie keer manueel de
representativiteitscontrole kunnen uitvoeren, maar dat hebben we niet gedaan, we hebben de
chikwadraattest in Excel gebruikt. Deze berekent de p-waarde op basis van de aantallen in de
steekproef en de verwachte aantallen wanneer de steekproef perfect zou overeenkomen met de
samenstelling van de populatie. De p-waarde= de kans dat je je vergist bij het verwerpen van de
nulhypothese (= de steekproef is representatief omdat de geobserveerde frequenties niet significant
afwijken van de verwachte frequenties). Je vindt het Excelbestand met de berekeningen bij
veldwerk.


Waarom is het belangrijk om de standaarddeviatie te hebben?

Het is belangrijk om te weten of de getallen in een reeks dicht rondom het gemiddelde liggen, of dat
ze meer verspreid zijn over de gehele range.

The benefits of buying summaries with Stuvia:

Guaranteed quality through customer reviews

Guaranteed quality through customer reviews

Stuvia customers have reviewed more than 700,000 summaries. This how you know that you are buying the best documents.

Quick and easy check-out

Quick and easy check-out

You can quickly pay through credit card or Stuvia-credit for the summaries. There is no membership needed.

Focus on what matters

Focus on what matters

Your fellow students write the study notes themselves, which is why the documents are always reliable and up-to-date. This ensures you quickly get to the core!

Frequently asked questions

What do I get when I buy this document?

You get a PDF, available immediately after your purchase. The purchased document is accessible anytime, anywhere and indefinitely through your profile.

Satisfaction guarantee: how does it work?

Our satisfaction guarantee ensures that you always find a study document that suits you well. You fill out a form, and our customer service team takes care of the rest.

Who am I buying these notes from?

Stuvia is a marketplace, so you are not buying this document from us, but from seller mganewouters. Stuvia facilitates payment to the seller.

Will I be stuck with a subscription?

No, you only buy these notes for $10.20. You're not tied to anything after your purchase.

Can Stuvia be trusted?

4.6 stars on Google & Trustpilot (+1000 reviews)

52355 documents were sold in the last 30 days

Founded in 2010, the go-to place to buy study notes for 14 years now

Start selling
$10.20
  • (0)
Add to cart
Added