AP Statistics Unit 1 Questions and Answers 2023
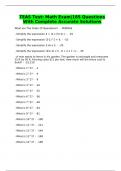
AP Statistics Unit 1 Questions and Answers 2023 variable holds information about the same characteristic for many subjects categorical variable where the data collected places the individuals in various categories or groups quantitative variable where the data collected is numerical and it makes sense to use it for numerical operations frequency table lists the categories for a categorical variable and displays the counts for each category relative frequency table lists the categories for a categorical variable and displays the percenatges for each category distribution describes how a quantitative variable behaves. Generally include shape, center, spread, & unusual features. bar chart a display for categorical data that uses bar height to represent counts or percentages for each category Simpson's Paradox When averages are taken across different groups, they can appear to contradict the overall averages histogram a display for quantitative data that uses adjacent bars to represent counts or percentages of values falling in each interval stem & leaf or stemplot a display for quantitative data that uses place values to reprensent the distributions dotplot a display for either kind of data that uses a dot to represent each individual in the data set measures of center mean for distributions that are symmetric, median for all other distribution shapes measures of spread standard deviation for distributions that are symmetric, IQR for all other distribution shapes uniform distribution a distribution whose shape is evenly distributed throughout the values it takes symmetric distribution a distribution whose shape is unimodal and each side is roughly a mirror image of the other left skewed distribution a distribution that has a concentration of data on the upper end and the tail on the left right skewed distribution a distribution with a concentration of data on the lower end and the tail on the right outliers values that fall outside the overall pattern of the data mean the average of the data values median the value in the center of an ordered data set range the maximum data value minus the minimum data value first quartile the value where 25 % of the data fall below it in an ordered list third quartile the value where 75% of the data falls below it in an ordered list Interquartile Range (IQR) the third quartile minus the first quartile percentile the place in the data where a certain percentage of the data falls below that value 5 number summary includes the minimum, first quartile, median, third quartile, & the maximum modified boxplot a display for quantitative data that graphs the five-number summary on an axis and shows outliers of they exist variance the standard deviation squared, it is a measure of spread advantage of stemplot retains the actual data values from the data set
Written for
- Institution
- Statistics
- Course
- Statistics
Document information
- Uploaded on
- May 13, 2023
- Number of pages
- 2
- Written in
- 2022/2023
- Type
- Exam (elaborations)
- Contains
- Questions & answers
Subjects
-
ap statistics unit 1 questions and answers 2023
-
variable holds information about the same characteristic for many subjects
-
frequency table lists the categories for a categorical variable and displays
Also available in package deal