Ana Ligthart, I6299483
Assignments
, WEEK3 - Seminar 3.2
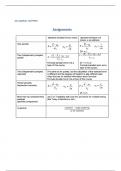
Statistical concepts to be discussed: one sample t-test, paired samples t-test, two or more
independent samples t-test, multiple comparison problem, t-test statistic
You need to memorize the standard error formula only of the one sample and paired sample t-
estimate−valueundert h enull h ypot h esis
test. Further T = in all situations
seoft h eestimate
Question 1 see SPSS instructions below!
Consider the following SPSS data file: ‘life event.sav’.
The life event study concerns the effect of a loss or illness of the partner on the state of well-
being (A. Nieboer et al., 1998). Two measurements on well-being were taken: baseline
measurement at time 0 (variable ‘wellbpre’ (the higher the score, the better)) and a follow up
measurement at 3 months after the life event (wellbpost (the higher the score, the better)). A
distinction is made between carers and widowers by means of the variable Group (carers, whose
partner has an illness incidence, coded as 1 and widowers, whose partner died, coded as 2). The
variable Gender is coded 1 for males, and 2 for females.
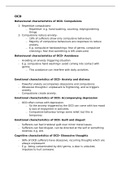
a. Perform a one-sample t-test to investigate whether the average wellbeing (at baseline) is
equal to 20 at population. Perform the analysis using the following steps
1. Formulate the null and alternative hypotheses
• Choose the significance level α =0.05 ,
• Use SPSS to perform the one sample t-test,
• Use as 95% C.I: ( X́ −1.972 se and X́ +1.972 se )
H 0 : μ=20
H A : μ ≠ 20
α =0.05
CI = X́ −1.972 se and X́ +1.972 se
CI: 95% = 26.0883 – 1.972 * 0.33026 = 25.437 en 26.0883 + 1.972 * 0.33026= 26.740
Assignments
, WEEK3 - Seminar 3.2
Statistical concepts to be discussed: one sample t-test, paired samples t-test, two or more
independent samples t-test, multiple comparison problem, t-test statistic
You need to memorize the standard error formula only of the one sample and paired sample t-
estimate−valueundert h enull h ypot h esis
test. Further T = in all situations
seoft h eestimate
Question 1 see SPSS instructions below!
Consider the following SPSS data file: ‘life event.sav’.
The life event study concerns the effect of a loss or illness of the partner on the state of well-
being (A. Nieboer et al., 1998). Two measurements on well-being were taken: baseline
measurement at time 0 (variable ‘wellbpre’ (the higher the score, the better)) and a follow up
measurement at 3 months after the life event (wellbpost (the higher the score, the better)). A
distinction is made between carers and widowers by means of the variable Group (carers, whose
partner has an illness incidence, coded as 1 and widowers, whose partner died, coded as 2). The
variable Gender is coded 1 for males, and 2 for females.
a. Perform a one-sample t-test to investigate whether the average wellbeing (at baseline) is
equal to 20 at population. Perform the analysis using the following steps
1. Formulate the null and alternative hypotheses
• Choose the significance level α =0.05 ,
• Use SPSS to perform the one sample t-test,
• Use as 95% C.I: ( X́ −1.972 se and X́ +1.972 se )
H 0 : μ=20
H A : μ ≠ 20
α =0.05
CI = X́ −1.972 se and X́ +1.972 se
CI: 95% = 26.0883 – 1.972 * 0.33026 = 25.437 en 26.0883 + 1.972 * 0.33026= 26.740