100% satisfaction guarantee Immediately available after payment Both online and in PDF No strings attached
logo-home
Summary Statistics EPH1026 $9.40
Add to cart

Summary

Summary Statistics EPH1026

 21 views  2 purchases
  • Course
  • Institution

Summary of statistics EPH1026

Preview 4 out of 33  pages

  • May 23, 2023
  • 33
  • 2021/2022
  • Summary
avatar-seller
Statistics NOTES
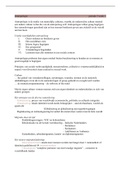
Holy trinity in statistics
● Estimates (µ , σ) mean, stdev
● Confidence interval
● Hypothesis testing

If you study people, you study statistics!

Random variable represents the experiments
→ if you conduct an experiment with random variables 1000 times and you make a histogram,
you would make a distribution.

Statistics about collecting data and recording variables and using those to try and make
generalisations about a population.


Terminology
● Descriptive statistics → summarising a sample of data using plots of numeric
summaries.
● Inferential stats → use data to infer something about a population by using a sample
to generalise to a population.
○ Inferential statistics → based on the premise that you can’t prove smth to be
true but you can disprove something by finding an exception.
○ E.g. estimation, hypothesis testing, prediction
● Unit/subject → entities on which data is collected
● Variable → recorded characteristic for unit/person/subject
● Population → group of interest for study
● Sample → Subset of population to study
● (population) parameter → quantity we want to know for whole population
● (sample) statistics / sample mean → estimate of parameter from the sample. →
average of the set of data. /
● External validity → generalizable to an external population
● Internal validity → is sample biassed?
● R = fit
● Anova = test of variance


1

,CHAPTER 1. EXPLORATORY DATA ANALYSIS: SUMMARIZING
AND DESCRIBING DATA.

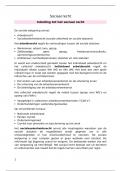
1.1 Types of variables
Variable → can be seen as a label name of a characteristic of, a subject which characteristic
differs from subject to subject (subject-specific)

Recorded piece of information or characteristic about a person, case or unit in our study.
Every characteristic differs per person. I.E. NOT a constant!!

Qualitative / categorical variable = nominal, ordinal → place people into groups
Quantitative / continuous variable = interval, ratio


Ordinal (qualitative) variables
● minimal level of measurement required to calculate a median

Type of variable determines which statistical technique can be used!


2

,1.2 Summarising data
1.2.1 Frequency distribution/ table
● Vertically
○ 1st column = scores
○ 2nd column = frequencies
○ Last + 5th column = cumulative %


1.2.2 Bar chart


● Distance between bars has NO MEANING and are NOT connected to each other!
● Often used to summarise outcome of a qualitative variable


3

, 1.2.3 Histogram


● Often used to summarise the outcome of a quantitative variable.
● No space between the bars, scores are connected as it should for interval and ratio
type of variables.
● Width of each bar IS meaningful
● Histogram is NOT informative for large sample sizes because the number of subjects
with scores in a specific class will also increase = very high bars.
○ If this is the case, present percentages instead of frequency
● Total area under all bars = 1


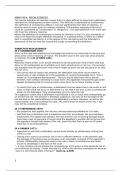
1.2.4 Boxplot
● Box plots help visualise the distribution of quantitative values in a field
● Use boxplots in 3 scenarios:
○ Visualise the distribution of values in a data set
○ To compare two or more distributions → compare the median values and the
spread of values between distributions.
○ To identify outliers


4

The benefits of buying summaries with Stuvia:

Guaranteed quality through customer reviews

Guaranteed quality through customer reviews

Stuvia customers have reviewed more than 700,000 summaries. This how you know that you are buying the best documents.

Quick and easy check-out

Quick and easy check-out

You can quickly pay through credit card or Stuvia-credit for the summaries. There is no membership needed.

Focus on what matters

Focus on what matters

Your fellow students write the study notes themselves, which is why the documents are always reliable and up-to-date. This ensures you quickly get to the core!

Frequently asked questions

What do I get when I buy this document?

You get a PDF, available immediately after your purchase. The purchased document is accessible anytime, anywhere and indefinitely through your profile.

Satisfaction guarantee: how does it work?

Our satisfaction guarantee ensures that you always find a study document that suits you well. You fill out a form, and our customer service team takes care of the rest.

Who am I buying these notes from?

Stuvia is a marketplace, so you are not buying this document from us, but from seller sennax. Stuvia facilitates payment to the seller.

Will I be stuck with a subscription?

No, you only buy these notes for $9.40. You're not tied to anything after your purchase.

Can Stuvia be trusted?

4.6 stars on Google & Trustpilot (+1000 reviews)

56326 documents were sold in the last 30 days

Founded in 2010, the go-to place to buy study notes for 14 years now

Start selling
$9.40  2x  sold
  • (0)
Add to cart
Added