Summary GCSE Geography Population and migration revision notes
4 views 0 purchase
Course
Geography
Institution
GCSE
This resource is a set of revision notes on the CCEA GCSE topic of Population and Migration. It includes subtopics such as births, deaths and natural change; demographic transition model; factors influencing population change;population structure; population pyramids; dependency ratios; implication...
• Rate
of
population
growth
has
varied
over
time
and
from
place
to
place
• In
1800,
the
vast
majority
of
population
lived
in
Europe
and
Asia
(86%)
with
65%
in
Asia
alone
• Since
1950
populations
has
multiplied
more
rapidly
than
before
and
ever
will
(especially
LEDC)
• In
1980
it
was
4.4
billion
and
in
1999,
6
billion
• Reached
7
billion
in
2011,
estimated
to
reach
9.3
billion
by
2050
• Growth
will
occur
in
48
least
developed
countries
which
will
nearly
triple
from
658
million
to
1.8
billion
Births,
deaths
and
natural
change
Demographers-‐
people
who
study
population
change
Crude
birth
rate-‐
number
of
live
births
per
thousand
of
the
population
in
an
area
per
year
[range
from
5
to
45
per
thousand
per
year]
Crude
death
rate-‐
number
of
deaths
per
thousand
of
the
population
of
an
area
per
year
[from
5
to
20
per
thousand
per
year
unless
famine,
epidemic
or
war]
Natural
change-‐
difference
between
birth
rate
and
death
rate
(birth
rate-‐
death
rate)
Natural
increase-‐
when
the
birth
rate
is
higher
than
the
death
rate,
normally
causing
population
to
rise
Natural
decrease-‐
when
the
death
rate
is
lower
than
the
birth
rate,
normally
causing
population
to
fall
Expressed
per
thousand
so
that
figures
for
different
sizes
can
be
compared
e.g.
china
has
1.3
billion
people
and
Luxemburg
only
500,000
Birth
rates
are
higher
in
LEDCs:
v There
is
no
access
to
knowledge
and
birth
control
so
families
have
many
children,
who
have
many
children
etc.
v Children
are
seen
as
a
sense
of
security
as
they
can
work
on
farms
v Higher
number
of
deaths
in
babies
so
families
will
have
more
in
case
some
die
Death
rates
low
in
both
MEDCs
and
LEDCs
v Good
health
care
in
MEDCs
and
improved
health
care
in
LEDCs
due
to
charity
work,
less
people
die
v Increasing
amount
of
vaccines
in
LEDCs,
less
people
become
ill
and
die
v Life
expectancy
increased
all
over
world
Countries
like
Canada,
Australia
and
UK
have
significantly
low
birth
rates,
between
8
and
13
births
per
1000.
These
are
MEDCs
whereas
LEDCs
such
as
Uganda,
Angola,
and
Democratic
republic
of
Congo
have
a
significantly
higher
birth
rate,
some
as
high
as
46
births
per
1000.
MEDCs
for
example
UK,
USA
and
Canada
has
a
death
rate
of
6-‐8
per
thousand.
This
is
significantly
lower
than
LEDC
countries
like
Kenya,
Uganda
and
Angola
can
have
up
to
as
much
as
14
deaths
per
thousand
• Until
recently
all
countries
has
natural
increase
except
in
case
of
epidemic
war
or
famine,
in
Europe
Black
Death
killed
1/3
of
population
in
1348-‐1353.
Today,
some
countries
have
reduced
birth
rates
so
much
they
are
experiencing
natural
decrease
and
population
is
declining
• This
data
gives
us
information
about
level
of
development
in
a
country,
all
now
have
low
death
rates
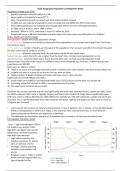
Demographic
transition
model
Stage
1-‐
high
fluctuating
pre
1760
in
UK,
modern
e.g.
amazon
tribes
High
birth
and
death
rate,
low
life
expectancy,
Low
total
population
High
birth
rates
because
• High
infant
mortality
rate
• Children
necessary
for
elderly
care,
no
pension
scheme
• Shortage
of
family
planning
facilities,
contraception
and
advice
• Religious
reasons-‐
tribes
in
central
Africa
promote
large
families
as
a
sign
of
wealth/
virility
, High
death
rates
because
• People
relied
on
dirty
unreliable
water
supplies
with
diseases
e.g.
cholera,
typhoid.
Particularly
fatal
for
children
•
Insanitary
toilet
facilities
spread
disease
e.g.
dysentery
• Poor
access
to
medical
services
due
to
large
distances
and
lack
of
transport.
People
died
of
treatable
diseases
e.g.
measles
and
diarrhoea
• Inadequate
diets,
short
in
calories
and/or
protein
shortened
life
expectancy
and
increased
death
rate
Stage
2-‐
early
expanding
1760-‐1880
in
UK,
modern
example-‐
Afghanistan,
high
birth
rate
dropping/lower
death
rate
(improved
medicine
and
hygiene),
increasing
total
population.
The
gap
between
BR
and
DR
results
in
population
growth
Stages
2-‐4
lower
death
rate
because
• Medical
services
accessible
to
all
e.g.
NHS,
3
doctors
to
every
1000
people
in
UK
• Good
housing
conditions
with
closed
sewage
systems,
avoiding
disease
• Fresh
water
for
all
households
reduces
threat
of
disease
e.g.
Cholera
from
dirty
water
(most
MEDCs)
•
Education
about
healthy
eating
and
have
access
to
balanced
nutritional
requirements
Agricultural
and
industrial
revolutions
in
Europe
and
North
America
1800
improved
food
production,
distribution
and
diet,
increasing
life
expectancy
and
lowering
death
rate
In
South
Africa
malaria
and
cholera
deaths
reducing
due
to
better
health
programs
run
by
World
health
organisation
The
green
revolution
in
India
after
1950
increased
food
production
and
supplied
more
variety
of
rice,
balanced
diet
Stage
3-‐
late
expanding
1880-‐1940
in
UK,
modern
example-‐
Kenya,
birth
rate
high
but
dropping
(availability
of
birth
control,
change
in
society),
death
rate
low,
total
population
high
In
Nigeria
hundreds
of
family
planning
clinics
have
opened
in
recent
years
advising
3-‐4
year
gaps
between
children
to
improve
standard
of
living
and
reduce
family
size
medical
advances
in
LEDCs
(India)
e.g.
measles
vaccinations
have
reduced
infant
mortality
rate
don’t
needs
to
have
as
many
children
for
some
to
survive
to
adulthood
In
MEDCs
e.g.
Sweden
average
age
of
first
child
is
28
due
to
women
being
more
career
driven
Stages
2-‐4
lower
birth
rates
because
• Costs
parents
£200,000
to
support
a
child
to
age
18
so
parents
choose
to
have
fewer
in
UK
(stage
3)
• Women
leave
having
children
later
due
to
having
a
career,
leads
to
smaller
family
size
• Increasing
emancipation
of
women
and
sexual
equality,
women
have
more
control
over
their
fertility
• Readily
available
family
planning,
contraception
and
advice
in
most
MEDCs
Stage
4-‐
low
fluctuating
1940-‐now
in
UK
other
examples-‐
Spain,
America,
low
birth
(women
focusing
on
jobs
and
more
equal
society)
and
death
rate
(only
influenced
by
war),
high
total
population
Stage
5-‐
natural
decrease-‐
future
of
UK,
modern
examples-‐
Italy,
low
birth
rate,
death
rate
low
but
higher
than
BR,
total
population
high
but
decreasing.
Life
expectancy
high
and
birth
rates
low
as
less
people
in
fertile
age
Western
economies
e.g.
Germany
and
Japan
have
more
career
opportunities
for
women
so
decide
to
be
childless
or
delay
childbirth,
less
children
born
while
more
people
surviving
into
old
age
due
to
medical
advances
cause
natural
decrease
Global
recession
in
2008
put
financial
pressure
on
people
so
they
focused
on
work
and
discouraged
people
from
having
babies,
led
to
smaller
families
and
natural
decrease
Other
factors
influencing
population
change
Agricultural
change
• Occur
early
in
country’s
development
• Technology
replaces
labourers
who
work
in
industry
instead
• Smaller
families
more
desirable
as
need
for
labourers
reduces
Urbanisation
• More
opportunity
in
cities
so
people
in
poor
countries
move
from
rural
to
urban
areas
• E.g.
education
• Child
labour
less
value
so
lower
rates
of
population
growth
in
urbanised
society
Education
• As
levels
of
educational
achievement
increase
children
are
a
disadvantage
as
parents
don’t
have
as
much
money
to
spend
on
each
• Parents
in
poorer
countries
see
this
as
the
best
chance
for
a
child’s
life
• Results
in
lower
population
growth
Emancipation
and
status
of
women
• As
development
increases
larger
workforce
needed
so
more
women
have
careers
• Household
has
more
money
as
there
are
two
incomes
• Over
time
equality
increases,
allowing
women
to
have
more
senior
positions
The benefits of buying summaries with Stuvia:
Guaranteed quality through customer reviews
Stuvia customers have reviewed more than 700,000 summaries. This how you know that you are buying the best documents.
Quick and easy check-out
You can quickly pay through credit card or Stuvia-credit for the summaries. There is no membership needed.
Focus on what matters
Your fellow students write the study notes themselves, which is why the documents are always reliable and up-to-date. This ensures you quickly get to the core!
Frequently asked questions
What do I get when I buy this document?
You get a PDF, available immediately after your purchase. The purchased document is accessible anytime, anywhere and indefinitely through your profile.
Satisfaction guarantee: how does it work?
Our satisfaction guarantee ensures that you always find a study document that suits you well. You fill out a form, and our customer service team takes care of the rest.
Who am I buying these notes from?
Stuvia is a marketplace, so you are not buying this document from us, but from seller hannahmccartney. Stuvia facilitates payment to the seller.
Will I be stuck with a subscription?
No, you only buy these notes for $6.83. You're not tied to anything after your purchase.