MTH1W/8 molenhuis unit: Relationships & Data lesson:
One-Variable – Measures of Spread (Quartiles, Box-Whisker Plots)
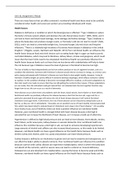
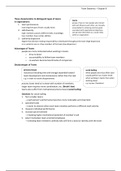
Central tendency Observe the three data sets on the left.
(mean, median, mode)
can show where the centre a) Do they have the same centre?
of the data is located.
However when we compare b) Do they have the same spread?
two data sets, not only do
we want to know whether c) Which one is more “spread out”?
their centres are relatively
close, but we also want to d) Which one is more “clustered”?
know if their data is spread
out the same way.
One method of measuring spread of data is by quartiles and box-whisker plots.
Ex1. For the data set:
7, 3, 1, 7, 6, 9, 3, 8, 5, 8, 6, 3, 7, 1, 9
(i) Order the data and find the median.
(ii) Find the median of the 1st half of the data.
(iii) Find the median of the 2nd half of data.
The ______________ divides the ordered data set into two halves and these halves are divided in halves again by the ________________.
a) Range measures the distance spreading out between the minimum data and the maximum data.
Calculate the range of this data set.
b) Interquartile Range (IQR): measures the distance spreading out by the middle 50% of the data.
This is calculated by ________________________________________. Calculate the IQR of this data set.
c) A box-whisker plot places the quartiles (Q1, Q2, Q3) and minimum, maximum on an x-scale so that we can visually see how
spread out each quartile (25% of the data) is. Construct a box-whisker plot for this set of data.
Steps of Plotting a Box-Whisker Plot
1
, MTH1W/8 molenhuis unit: Relationships & Data lesson:
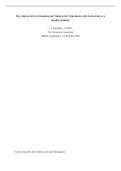
Ex2. The following side-by-side boxplots compare the daily times students in year 9 and 12 spend on homework.
a) Complete the table:
Statistic Year 9 Year 12
Minimum
Q1
Median
Q3
Maximum
Range
Interquartile Range
b) True or False: (Justify your answer)
(i) The median of Year 12 students spend about double the time on homework compared to the median of Year 9 students.
(ii) At least 25% of Year 9 students spend less time on homework than all Year 12 students.
(iii) The variety of homework time among Year 12 students is more than Year 9 students.
(iv) There is more variety of homework time in the lower half of the Year 12 group than the upper half.
2
One-Variable – Measures of Spread (Quartiles, Box-Whisker Plots)
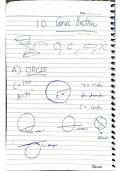
Central tendency Observe the three data sets on the left.
(mean, median, mode)
can show where the centre a) Do they have the same centre?
of the data is located.
However when we compare b) Do they have the same spread?
two data sets, not only do
we want to know whether c) Which one is more “spread out”?
their centres are relatively
close, but we also want to d) Which one is more “clustered”?
know if their data is spread
out the same way.
One method of measuring spread of data is by quartiles and box-whisker plots.
Ex1. For the data set:
7, 3, 1, 7, 6, 9, 3, 8, 5, 8, 6, 3, 7, 1, 9
(i) Order the data and find the median.
(ii) Find the median of the 1st half of the data.
(iii) Find the median of the 2nd half of data.
The ______________ divides the ordered data set into two halves and these halves are divided in halves again by the ________________.
a) Range measures the distance spreading out between the minimum data and the maximum data.
Calculate the range of this data set.
b) Interquartile Range (IQR): measures the distance spreading out by the middle 50% of the data.
This is calculated by ________________________________________. Calculate the IQR of this data set.
c) A box-whisker plot places the quartiles (Q1, Q2, Q3) and minimum, maximum on an x-scale so that we can visually see how
spread out each quartile (25% of the data) is. Construct a box-whisker plot for this set of data.
Steps of Plotting a Box-Whisker Plot
1
, MTH1W/8 molenhuis unit: Relationships & Data lesson:
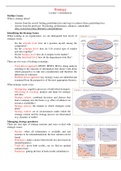
Ex2. The following side-by-side boxplots compare the daily times students in year 9 and 12 spend on homework.
a) Complete the table:
Statistic Year 9 Year 12
Minimum
Q1
Median
Q3
Maximum
Range
Interquartile Range
b) True or False: (Justify your answer)
(i) The median of Year 12 students spend about double the time on homework compared to the median of Year 9 students.
(ii) At least 25% of Year 9 students spend less time on homework than all Year 12 students.
(iii) The variety of homework time among Year 12 students is more than Year 9 students.
(iv) There is more variety of homework time in the lower half of the Year 12 group than the upper half.
2