Samenvatting 5.1 Lineaire formules [1] - Willem-Jan van der Zanden
1 view 0 purchase
Course
Mathematics
Institution
Mathematics
5.1 Lineaire formules [1] - Willem-Jan van der Zanden
Voorbeeld :
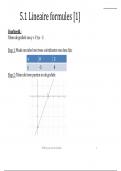
Teken de grafiek van y = 1½x - 3
Stap 1: Maak een tabel met twee coördinaten van deze lijn:
Stap 2: Teken de twee punten en de grafiek:
5.1 Lineaire formules [1]
Voorbeeld :
Teken de grafiek van y = 1½x - 3
Stap 1: Maak een tabel met twee coördinaten van deze lijn:
x 0 2
y -3 0
Stap 2: Teken de twee punten en de grafiek:
Willem-Jan van der Zanden 1
, 5.1 Lineaire formules [1]
De formule y = 1½x – 3 is een lineaire formule.
Er bestaat nu een lineair verband tussen x en y.
Algemeen:
• De grafiek van een lineaire functie is een lijn;
• In de tabel van een lineaire grafiek zet je twee punten. Dat is voldoende
om de grafiek te kunnen tekenen;
• Maak bij het tekenen van een (lineaire) formule altijd een tabel;
• Zet de (naam van de) formule bij de getekende lijn;
• Zet namen (letters) bij de assen.
Willem-Jan van der Zanden 2
, 5.1 Lineaire formules [2]
Voorbeeld 1:
Gegeven is de grafiek y = 1½x – 3
x -1 0 1 2 3 4 5 6
y -4½ -3 -1½ 0 1½ 3 4½ 6
Uit de tabel volgt:
1) Als x met 1 toeneemt neemt y met 1½ toe;
2) Als je in de grafiek 1 naar rechts gaat, ga je 1½ omhoog;
3) Het snijpunt van de grafiek met de y-as is het punt (0, -3);
Uit de formule volgt:
1) Het getal 1½ in de formule voor geeft aan hoeveel de grafiek
verandert als je 1 naar rechts gaat;
2) Het getal -3 in de formule geeft het snijpunt (0, -3) met de y-as aan.
Willem-Jan van der Zanden 3
, 5.1 Lineaire formules [2]
Voorbeeld 2:
In het plaatje hiernaast zijn de
grafieken y = 1½x – 3 en y = 1½x + 2
getekend.
In het plaatje staan nu twee
evenwijdige lijnen.
Voor beide grafieken geldt:
Ga je 1 naar rechts, dan ga je 1½
omhoog.
Willem-Jan van der Zanden 4
The benefits of buying summaries with Stuvia:
Guaranteed quality through customer reviews
Stuvia customers have reviewed more than 700,000 summaries. This how you know that you are buying the best documents.
Quick and easy check-out
You can quickly pay through credit card or Stuvia-credit for the summaries. There is no membership needed.
Focus on what matters
Your fellow students write the study notes themselves, which is why the documents are always reliable and up-to-date. This ensures you quickly get to the core!
Frequently asked questions
What do I get when I buy this document?
You get a PDF, available immediately after your purchase. The purchased document is accessible anytime, anywhere and indefinitely through your profile.
Satisfaction guarantee: how does it work?
Our satisfaction guarantee ensures that you always find a study document that suits you well. You fill out a form, and our customer service team takes care of the rest.
Who am I buying these notes from?
Stuvia is a marketplace, so you are not buying this document from us, but from seller tandhiwahyono. Stuvia facilitates payment to the seller.
Will I be stuck with a subscription?
No, you only buy these notes for $2.72. You're not tied to anything after your purchase.