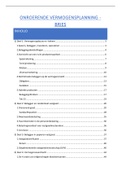
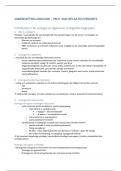
Article 1 “No price like home: global house prices, 1870 – 2012” – Knoll, Schularick & Steger (2017)
.................................................................................................................................................................. 2
Article 3 “Are public and private asset returns and risk the same? Evidence from real estate data” –
Hoesli & Oikarinen................................................................................................................................... 5
Article 4 “How housing associations lose their value: the value gap in The Netherlands” – Conijn &
Schilder (2010) ........................................................................................................................... 10
Article 6 “Correlation dynamics and determinants in international securitized real estate markets”
– Liow, zhou & Ye (2015) ............................................................................................................ 13
Article 7 “Office rent indices and their behavior over time” – Wheaton & Torto (1994) ................ 18
Article 8 “Mortgage market design” – Campbell (2012) ............................................................... 21
Article 9 “House prices and rents: Microevidence from a matched data set in central London” –
Bracke (2015) ............................................................................................................................. 29
Article 10a “Inflation protection from homeownership: long-run evidence, 1814-2008” – Brounen,
Eichholtz, Staetmans & Theebe (2013) ........................................................................................ 32
Article 10b “Another take on real estate’s role in mixed-asset portfolio allocations” – Joseph &
Pagliari (2017) ............................................................................................................................ 35
Article 11 “Social Networks and Housing Markets” – Bailey, Cao, Kuchler & Stroebel (2016)......... 41
Article 12 “Building functional cities” – Henderson, Venables, Regan & Samsonov (2016) ............ 46
1
,Article 1 “No price like home: global house prices, 1870 – 2012” – Knoll, Schularick & Steger (2017)
Abstract: How have house prices evolved over the long run? This paper presents annual house prices
for 14 advanced economies since 1870. We show that real house prices stayed constant from the
nineteenth to the mid-twentieth century, but rose strongly and with substantial cross-country
variation in the second half of the twentieth century. Land prices, not replacement costs, are the key
to understanding the trajectory of house prices. Rising land prices explain about 80 percent of the
global house price boom that has taken place since World War II. Our findings have implications for
the evolution of wealth-to-income ratios, the growth effects of agglomeration, and the price
elasticity of housing supply.
Introduction
Houses are heterogeneous assets and when combining data from a variety of sources great care is
needed to construct long-run indices that account for quality improvements, shifts in the
composition of the type of houses and their location. Controlling for quality changes and shifts in the
overall quality-mix of transacted houses is arguably the main challenge for the construction of house
price indices over extended periods.
From the last quarter of the nineteenth to the mid-twentieth century, house prices in most industrial
economies were largely constant in real (CPI-deflated) terms. By the 1960s they were, on average,
not much higher than they were on the eve of World War I. They have been on a long and
pronounced ascent since then, giving rise to a hockey-stick pattern of house prices in the long run.
While house prices have increased in all countries over the past 140 years, we also find considerable
cross-country heterogeneity. Australia has seen the strongest, Germany the weakest, increase in real
house prices since 1870. House prices have broken out of their historical range in almost all countries
in the second half of the twentieth century. Yet, cross-country differences also extend to the timing
of the surge of house prices. In most countries it occurred in the 1960s and 1970s, in some countries
the trajectory began to change shortly after World War II, and in others only after 1990. Japan is the
only country in which house prices fell significantly over the past two decades.
Houses are bundles of the structure and the underlying land. An accounting decomposition of house
price dynamics into replacement costs of the structure and land prices demonstrates that rising land
prices hold the key to understanding the upward trend in global house prices. While construction
costs have flat-lined in the past decades, sharp increases in land prices drove up housing values.
This finding challenges the view that in the long run the price elasticity of housing supply is high as
additional land for construction may not be readily available at constant cost. The late twentieth
century surge in wealth-to-income ratios in Western economies is largely due to increasing housing
wealth. Higher land prices can push up wealth-to-income ratios even if the capital-to-income ratio
stays constant. The critical importance of land prices for the trajectory of wealth-to-income ratios
evokes the principle of scarcity: over the long run, economic growth profits landlords
disproportionately, as the owners of the fixed factor. Since land is unequally distributed across the
population, market economies would produce rising inequality.
Data
House price indices: An ideal house price index captures the appreciation of the price of a standard,
unchanged house. Yet, houses are heterogeneous assets whose characteristics change over time.
Houses are also sold infrequently, making it difficult to observe their pricing over time. Four main
challenges are involved in constructing consistent long-run house price indices. These relate to
differences in the geographic coverage, the type and vintage of the house, the source of pricing, and
the method used to adjust for quality and composition changes.
2
, First, house price indices may either be national or cover several cities or regions. Whereas rural
indices may underestimate house price appreciation, urban indices may be upwardly biased. Second,
house prices can either refer to new or existing homes, or a mix of both. Price indices that cover only
newly constructed properties may underestimate overall property price appreciation if new
construction tends to be located in areas where supply is more elastic. Third, prices can come from
sale prices in the market, listing prices or appraised values. Fourth, if the quality of houses improves
over time, a simple mean or median of observed prices can be upwardly biased.
Historical house price data: As a general rule, we chose constant quality indices where available and
opted for longitudinal consistency as well as historical plausibility. A central challenge for the
construction of long-run price indices relates to quality changes.
Aggregate trends
We show that real house prices in advanced economies have on average risen threefold since 1900
and that the overwhelming share of this increase occurred in the second half of the twentieth
century. The long-run trajectory of global house prices displays a hockey-stick pattern: real house
prices remained broadly stable from the late nineteenth century to World War II. They trended
upward in the postwar decades and have seen a particularly steep incline since the late 1980s.
Robustness checks
Subsamples: It turns out that house price appreciation was somewhat stronger in the small European
countries than it was in the large economies. Trends are similar in countries that experienced major
war destruction on their own territory and countries that did not.
Quality improvements: Indices that do not control for quality improvements will overstate the price
increase over time. The most significant improvements in housing quality (running water and
electricity) entered the standard home in the first half of the twentieth century and some of our
indices in this period are based on mean or median prices. Second, the composition of the housing
stock may change in response to secular trends such as urbanization or the business cycle. If more
low quality houses were transacted, mean or median price indices could understate the price
increase that occurred before World War II. Some uncertainty remains as to which of these two
opposing effects dominates in the pre-World War II period. On the one hand, there could be a
potential overstatement of price increases because of rapid quality improvements, but on the other
hand, price increases could also be understated because of a deteriorating quality-mix.
Composition shift: If the statistical coverage of house price data shifted from (cheap) rural to
(expensive) urban prices over time, this could mechanically push up the average prices that we
observe, even if rural and urban prices remain constant over time. It turns out that the share of
urban prices is declining over time, mainly because many of the early house price observations rely
on city data only. Compositional shifts are not responsible for the patterns that we observe.
Urban and rural price dynamics: It remains, however, a possibility that the strong rise in house prices
since the 1960s was predominantly an urban phenomenon, driven by a growing attractiveness of
cities. It is essential to separately examine the evidence we have on price trends in rural vis-à-vis
urban areas. Farmland prices can serve as a rough proxy for nonurban prices if the price of rural land
used for farming and the price of land used for rural housing move together in the long run. Clearly,
farmland is cheaper than building land per area unit, but the long-run trajectories appear similar.
Both rural and urban house prices trended strongly upward in recent decades. While the increase in
house prices has been most pronounced in cities, it is not exclusively an urban phenomenon.
3


