,Statistical Computing with R Second Edition
Instructor Solution Manual
Maria L. Rizzo
June 30, 2019
,Contents
1 Introduction 3
3 Methods for Generating Random Variables 12
4 Generating Random Processes 33
5 Visualization of Multivariate Data 37
6 Monte Carlo Integration and Variance Reduction 69
7 Monte Carlo Methods in Inference 85
8 Bootstrap and Jackknife 99
9 Resampling Applications 120
10 Permutation Tests 140
11 Markov Chain Monte Carlo Methods 156
12 Density Estimation 194
13 Introduction to Numerical Methods in R 218
14 Optimization 226
15 Programming Topics 230
2
, Chapter 1
Introduction
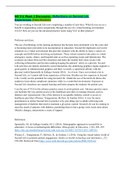
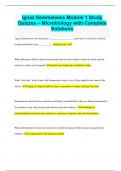
1.1 Generate a random sample x1 , . . . , x100 of data from the t4 (df=4) distri-
bution using the rt function. Use the MASS::truehist function to display a
probability histogram of the sample.
library(MASS)
x <- rt(100, df = 4)
truehist(x)
0.25
0.20
0.15
0.10
0.05
0.00
−10 −5 0 5 10 15
x
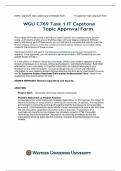
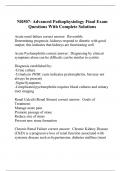
1.2 Add the t4 density curve (dt) to your histogram in Exercise 1.1 using the
curve function with add=TRUE.
3
Instructor Solution Manual
Maria L. Rizzo
June 30, 2019
,Contents
1 Introduction 3
3 Methods for Generating Random Variables 12
4 Generating Random Processes 33
5 Visualization of Multivariate Data 37
6 Monte Carlo Integration and Variance Reduction 69
7 Monte Carlo Methods in Inference 85
8 Bootstrap and Jackknife 99
9 Resampling Applications 120
10 Permutation Tests 140
11 Markov Chain Monte Carlo Methods 156
12 Density Estimation 194
13 Introduction to Numerical Methods in R 218
14 Optimization 226
15 Programming Topics 230
2
, Chapter 1
Introduction
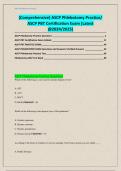
1.1 Generate a random sample x1 , . . . , x100 of data from the t4 (df=4) distri-
bution using the rt function. Use the MASS::truehist function to display a
probability histogram of the sample.
library(MASS)
x <- rt(100, df = 4)
truehist(x)
0.25
0.20
0.15
0.10
0.05
0.00
−10 −5 0 5 10 15
x
1.2 Add the t4 density curve (dt) to your histogram in Exercise 1.1 using the
curve function with add=TRUE.
3