MRM lecture 1
FACTOR ANALYSES
How do customers think about our product?
What are aspects that are good?
➢ Often, one-item scales:
o Do you like the taste of this brand?
o How old are you?
But, marketing concepts are more often too complicated for one item scales
So: multi item scales
- Attitudes
- Lifestyles
Another but: multi-item scales often have too many items for further analysis
➢ Reduce data again
o So, data reduction
▪ Factor analysis
▪ Reliability analysis
SCALES
➢ How to develop multi-item scales?
o Multi-stage process
Data analysis often in 2 stages
➢ Stage 1: inspection and preparing data for final analysis
o Inspection of data (items)
▪ Which variables / measurement scales / coding scheme
• Get a feeling for the data
▪ Cleaning your dataset
• Oddities, missing/wrong values, outliers…
o Age 165? Probably not right
o Missing age?
• Combining items into new dimensions
o E.g. factor / reliability
➢ Stage 2: Finally analysis, testing your hypotheses
, o E.g. regression analysis using the new dimensions instead of original items
Crap in = crap out if your data is crap, your outcome will be crap.
FACTOR ANALYSIS
➢ Purpose:
o Reduction of a large quantity of data by finding common variance to
▪ Retrieve underlying dimensions in your dataset, or
▪ Test if the hypothesized dimensions also exist in you dataset.
➢ Two central questions
o How to reduce a large(r) set of variables into a smaller set of uncorrelated factors?
▪ Unknown number and structure
▪ Hypothesized number and structure
o How to interpret these factors (= underlying dimensions), and scores on these
factors?
➢ On exam; technically rights means 50% of the points, use granny check. Say in easy language
what it means
Factor analysis: what is it about?
➢ Ultimate goal
o Use dimensions in further analysis
▪ E.g. position brands on these dimensions (with the supermarkets example;
price versus service)
▪ E.g. relationship export performance and attitude entrepreneur (regression)
➢ Data
o Interval or ratio scaled variables
▪ Likert scales; 1-5 or 1-7 for example
▪ Often ordinal, but assumed interval (likert)
➢ Note:
o No distinction is made between dependent (Y) and independent (X) variables!
▪ But: FA is usually applied to your independent variables (X)
▪ No causal relation between the variables
➢ Data reduction
o Metrical data on N items
o Summarize the items into p < n ‘factors’
▪ Hence; data reduction
o Two ways to do so
▪ Factor analysis
• Newer technique
• Mostly used for multi-item scales
• ‘Absolute’ method
• Covered in this course
▪ Multidimensional scaling
• Older technique
• Often used for positioning research
• ‘relative method’
• Not covered here
➢ Why can we reduce the number of variables?
, o If multiple things look the same, why not including a combination instead of
including all of them separately?
➢ Strong correlations between two or more items
o Same underlying phenomenon
o So combine, to get
▪ Parsimony (explaining a lot by little)
▪ Less multicollinearity in subsequent analysis (regression analysis)
• If variables are highly correlated, it’s hard to distinguish their effects
in regression
Just a first check, very rough, gives you an idea what might work in the end to combine variables in 1
and the same factor.
Basic concept
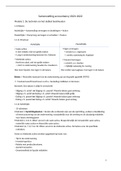
➢ Suppose we have X1, X2, X3, X4, X5, X6
➢ Any set of variables X1… X6 can be expressed as a linear combination of other variables, called
factors F1, F2, F3, F4, F5, F6 based on common variance in X1… X6
➢ You choose only the ‘strongest factors’
o Best number of factors unknown upfront
o E.g. 2 factors F1 & F2
o You try to explain as much as possible of X in as few as possible F’s
➢ Will never be done perfectly, info gets lost
o E.g. F3, F4, F5 and F6 are not being used.
➢ All variables load more (thick arrow) or less (thin arrow) on all factor
, ➢ We are looking for high-loading items
o We are interested in high loading (marker items) to label the dimensions (loading >
.5)
▪ The other lines are still ‘there’
➢
➢ Dimensions
o From now on, we only work with the dimensions = combinations of the original
items.
o The dimensions retrieved are now uncorrelated with each other
➢ Summarizing
o From n (way larger) >> m items
o Which items?
o Suitable items?
o How many dimensions?
o Suitable dimensions?
o Content / label dimensions?
➢ Important:
o Items = variables = survey questions
o Dimensions = factors = components
➢ STEPS for FA using SPSS
Step 1 Research purpose
▪ Which variables? How many? Sample size?
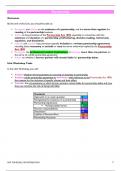
Step 2 Is FA appropriate?
▪ KMO measure of sampling adequacy
• Sampling adequacy predicts if data are likely to factor well, based
correlation
• If KMO < .5, drop variable with lowest individual KMO statistics
• Bartlett’s test of sphericity
o H0: variables are uncorrelated, i.e. the identity matrix
o If we cannot reject H0, no correlations can be established
o We need correlation among the variables, we need to reject
the H0 of uncorrelated variables.
• NOTE: also check the communalities
o Common rule: > .4
FACTOR ANALYSES
How do customers think about our product?
What are aspects that are good?
➢ Often, one-item scales:
o Do you like the taste of this brand?
o How old are you?
But, marketing concepts are more often too complicated for one item scales
So: multi item scales
- Attitudes
- Lifestyles
Another but: multi-item scales often have too many items for further analysis
➢ Reduce data again
o So, data reduction
▪ Factor analysis
▪ Reliability analysis
SCALES
➢ How to develop multi-item scales?
o Multi-stage process
Data analysis often in 2 stages
➢ Stage 1: inspection and preparing data for final analysis
o Inspection of data (items)
▪ Which variables / measurement scales / coding scheme
• Get a feeling for the data
▪ Cleaning your dataset
• Oddities, missing/wrong values, outliers…
o Age 165? Probably not right
o Missing age?
• Combining items into new dimensions
o E.g. factor / reliability
➢ Stage 2: Finally analysis, testing your hypotheses
, o E.g. regression analysis using the new dimensions instead of original items
Crap in = crap out if your data is crap, your outcome will be crap.
FACTOR ANALYSIS
➢ Purpose:
o Reduction of a large quantity of data by finding common variance to
▪ Retrieve underlying dimensions in your dataset, or
▪ Test if the hypothesized dimensions also exist in you dataset.
➢ Two central questions
o How to reduce a large(r) set of variables into a smaller set of uncorrelated factors?
▪ Unknown number and structure
▪ Hypothesized number and structure
o How to interpret these factors (= underlying dimensions), and scores on these
factors?
➢ On exam; technically rights means 50% of the points, use granny check. Say in easy language
what it means
Factor analysis: what is it about?
➢ Ultimate goal
o Use dimensions in further analysis
▪ E.g. position brands on these dimensions (with the supermarkets example;
price versus service)
▪ E.g. relationship export performance and attitude entrepreneur (regression)
➢ Data
o Interval or ratio scaled variables
▪ Likert scales; 1-5 or 1-7 for example
▪ Often ordinal, but assumed interval (likert)
➢ Note:
o No distinction is made between dependent (Y) and independent (X) variables!
▪ But: FA is usually applied to your independent variables (X)
▪ No causal relation between the variables
➢ Data reduction
o Metrical data on N items
o Summarize the items into p < n ‘factors’
▪ Hence; data reduction
o Two ways to do so
▪ Factor analysis
• Newer technique
• Mostly used for multi-item scales
• ‘Absolute’ method
• Covered in this course
▪ Multidimensional scaling
• Older technique
• Often used for positioning research
• ‘relative method’
• Not covered here
➢ Why can we reduce the number of variables?
, o If multiple things look the same, why not including a combination instead of
including all of them separately?
➢ Strong correlations between two or more items
o Same underlying phenomenon
o So combine, to get
▪ Parsimony (explaining a lot by little)
▪ Less multicollinearity in subsequent analysis (regression analysis)
• If variables are highly correlated, it’s hard to distinguish their effects
in regression
Just a first check, very rough, gives you an idea what might work in the end to combine variables in 1
and the same factor.
Basic concept
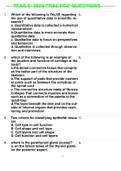
➢ Suppose we have X1, X2, X3, X4, X5, X6
➢ Any set of variables X1… X6 can be expressed as a linear combination of other variables, called
factors F1, F2, F3, F4, F5, F6 based on common variance in X1… X6
➢ You choose only the ‘strongest factors’
o Best number of factors unknown upfront
o E.g. 2 factors F1 & F2
o You try to explain as much as possible of X in as few as possible F’s
➢ Will never be done perfectly, info gets lost
o E.g. F3, F4, F5 and F6 are not being used.
➢ All variables load more (thick arrow) or less (thin arrow) on all factor
, ➢ We are looking for high-loading items
o We are interested in high loading (marker items) to label the dimensions (loading >
.5)
▪ The other lines are still ‘there’
➢
➢ Dimensions
o From now on, we only work with the dimensions = combinations of the original
items.
o The dimensions retrieved are now uncorrelated with each other
➢ Summarizing
o From n (way larger) >> m items
o Which items?
o Suitable items?
o How many dimensions?
o Suitable dimensions?
o Content / label dimensions?
➢ Important:
o Items = variables = survey questions
o Dimensions = factors = components
➢ STEPS for FA using SPSS
Step 1 Research purpose
▪ Which variables? How many? Sample size?
Step 2 Is FA appropriate?
▪ KMO measure of sampling adequacy
• Sampling adequacy predicts if data are likely to factor well, based
correlation
• If KMO < .5, drop variable with lowest individual KMO statistics
• Bartlett’s test of sphericity
o H0: variables are uncorrelated, i.e. the identity matrix
o If we cannot reject H0, no correlations can be established
o We need correlation among the variables, we need to reject
the H0 of uncorrelated variables.
• NOTE: also check the communalities
o Common rule: > .4