100% satisfaction guarantee Immediately available after payment Both online and in PDF No strings attached
logo-home
Samenvatting Economische crisis LWEO hoofdstuk 8 $3.23   Add to cart

Summary

Samenvatting Economische crisis LWEO hoofdstuk 8

4 reviews
 205 views  0 purchase
  • Course
  • Level
  • Book

Heel hoofdstuk 8 'Phillipscurve' uit Economische crisis LWEO van economie samengevat waaronder ook informatie uit de opdrachten(zie ook de bundel Economische crisis voor het gehele boek). De stof is 'up to date' dus ook informatie uit de appendix is erin opgenomen. Ik heb zelf figuren zoals tabelle...

[Show more]
Preview 1 out of 4  pages

  • No
  • Hoofdstuk 8
  • November 8, 2017
  • 4
  • 2017/2018
  • Summary
  • Secondary school
  • 102

4  reviews

review-writer-avatar

By: KalleIjsveld • 3 year ago

review-writer-avatar

By: casfgmeuwissen • 3 year ago

review-writer-avatar

By: celinalodewijks • 4 year ago

review-writer-avatar

By: Oefentoetsen • 5 year ago

avatar-seller
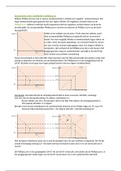
Economische crisis, hoofdstuk 8, philipscurve
William Phillips liet zien dat er tussen werkeloosheid en inflatie een negatief verband bestaat. Een
hoge werkeloosheid gaat gepaard met een lagere inflatie. Dit negatieve verband noem je de
Phillipscurve. Miltoen Friedman heeft aangetoond dat het negatieve verband alleen op de korte
termijn geldt. De oorspronkelijke Phillipscurve noemen we daarom de Phillips Curve op de Korte
Termijn(PCKT):
Inflatie (%) Totdat in het midden van de jaren ’70 de oliecrisis uitbrak, werd
deze oorspronkelijke Phillipscurve gebruikt bij het economisch
beleid. Het leek mogelijk inflatie en werkeloosheid tegen elkaar uit
te ruilen. Door het juiste begrotings- en monetair beleid te voeren
kon een recessie worden tegengegaan door een hogere inflatie te
accepteren. Het verband uit de Phillipscurve zie je ook terug in het
0%
Werkeloosheid . geaggregeerde-vraag-en-aanbodmodel, namelijk in de GA-KT lijn.
(%)
Deze schetst een positieve samenhang
Tussen het prijspeil en het reële bbp. Deze toename van het bbp veroorzaakt een grotere vraag naar
arbeid en daarmee een afname van de werkeloosheid. De Phillipscurve is een spiegelbeeld van de
GA-KT. Bij beid curves gaat een hoger prijspeil samen met een lagere werkeloosheid.
Inflatie (%) GA-KT
Algemeen prijspeil


4
104

2 100


0%
3 5 Werkeloosheid .
(%)

9,5 9,7 Reëel bbp (x100 miljard)


Voorbeeld: Veronderstel dat de arbeidsproductiviteit in deze economie 100.000,- bedraagt.
Laat zien dat de beroepsbevolking 10 miljoen arbeidsjaren is:
Bij een inflatie van 2% is het prijspeil 100 en het bbp 950 miljard. De werkgelegenheid is
950 miljard/100.000= 9,5 miljoen
Bereken met hoeveel arbeidsjaren de werkeloosheid afneemt als de inflatie stijgt van 2% naar 4%:
Toename bbp/arbeidsproductiviteit = 20 miljard/100.000 = 200.000 arbeidsjaren

GV’ GA-LT GA-KT
Inflatie (%) Algemeen prijspeil

GV

B B
4
104
A A
2 100


0%
3 5 Werkeloosheid .
(%)

9,5 9,7 Reëel bbp (x100 miljard)

Met de figuren hierboven gaan we na wat de gevolgen zijn van een positieve vraagschok. De GV-lijn
schuift evenwijdig omhoog GV’. Het korte termijn evenwicht tussen de GV en GA verschuift van A
naar B.

De Phillipscurve is een gespiegelde GA-KT. Als de GA-KT verschuift, verschuift ook de Phillipscurve. In
het geaggregeerde model zagen we de GA-KT verschuiven als er een aanbodschok optreedt.

The benefits of buying summaries with Stuvia:

Guaranteed quality through customer reviews

Guaranteed quality through customer reviews

Stuvia customers have reviewed more than 700,000 summaries. This how you know that you are buying the best documents.

Quick and easy check-out

Quick and easy check-out

You can quickly pay through credit card or Stuvia-credit for the summaries. There is no membership needed.

Focus on what matters

Focus on what matters

Your fellow students write the study notes themselves, which is why the documents are always reliable and up-to-date. This ensures you quickly get to the core!

Frequently asked questions

What do I get when I buy this document?

You get a PDF, available immediately after your purchase. The purchased document is accessible anytime, anywhere and indefinitely through your profile.

Satisfaction guarantee: how does it work?

Our satisfaction guarantee ensures that you always find a study document that suits you well. You fill out a form, and our customer service team takes care of the rest.

Who am I buying these notes from?

Stuvia is a marketplace, so you are not buying this document from us, but from seller maritheijmans. Stuvia facilitates payment to the seller.

Will I be stuck with a subscription?

No, you only buy these notes for $3.23. You're not tied to anything after your purchase.

Can Stuvia be trusted?

4.6 stars on Google & Trustpilot (+1000 reviews)

59325 documents were sold in the last 30 days

Founded in 2010, the go-to place to buy study notes for 14 years now

Start selling
$3.23
  • (4)
  Add to cart