100% satisfaction guarantee Immediately available after payment Both online and in PDF No strings attached
logo-home
SPSS Block 1 Cheat Sheet - A summary of all necessary procedures step by step $4.82   Add to cart

Summary

SPSS Block 1 Cheat Sheet - A summary of all necessary procedures step by step

 16 views  0 purchase
  • Module
  • Institution
  • Book

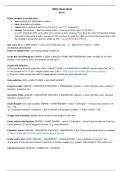
This is the only document you'd need to bring with you in the SPSS Block 1 exam. It has all the procedures you need to know written clearly step by step. It is the only thing I used in my SPSS exam, and I got a 10.

Preview 1 out of 2  pages

  • Yes
  • November 4, 2023
  • 2
  • 2022/2023
  • Summary
avatar-seller
SPSS cheat sheet
Block 1

Define variables in variable view:
 type: numerical or String (text as value)
 label: description of variable
 values: click on dots and add (also add missing values! 9 = ”unknown”)
 missing: click on dots -> discrete missing values -> type up to three codes (9, 99, 999...)
(careful: sometimes SPSS reads either over commas or dots, meaning if you have the value 9.99 and the settings
only read it if you write it with a comma, so 9,99, you have to make sure that you write it the proper way so that
the variable is recognized, and not written as 999 => ALWAYS DOUBLE CHECK!)

Sort cases: DATA → SORT CASES → can be seen in the data view -or- Right click on collumn -> SORT
ASCENDING/DESCENDING
Return to original order: sort by Respondent Number/ID

Create Bar Chart/Histogram: GRAPHS → LEGACY DIALOGS → BAR CHART/HISTOGRAM: select variable (or via chart
builder) + if you want a curve: tick “Display normal curve”

Graphs with selection:
1. First you have to make a selection: DATA → SELECT CASES → IF CONDITION IS SATISFIED: specify criteria (e.g. V6 = 1
=> sex is female or V7 < 1,60 => height is lower than 1,60) => SPSS crosses out variables that are not selected
2. Then just create a graph normally (it’s automatically created only with selected cases)

Undo selection: DATA → SELECT CASES → ALL CASES or RESET

Frequency table: ANALYZE → DESCRIPTIVE STATISTICS → FREQUENCIES: Statistics → select stuff like mean, standard
deviation, maximum, etc.

Descriptive Table: ANALYZE → DESCRIPTIVE STATISTICS → DESCRIPTIVES: Options → select stuff like mean, standard
deviation, maximum, etc.

Create Boxplot (one single variable): GRAPHS -> CHART BUILDER -> select “1-D Boxplot” -> Drag & drop variable on X
axis -> OK
-or- via LEGACY DIALOGS -> BOXPLOT -> tick “Summaries of separate variables” -> Select variable -> OK

Change color of boxplot: double click on boxplot in the output & edit color

Create side-by-side Boxplots: GRAPHS -> CHART BUILDER -> select “1-D Boxplot” -> Drag & drop variable on X axis (e.g.
Total Optimism) & Y axis (Categories we have – e.g. males/females)

Calculate z scores: ANALYZE -> DESCRIPTIVE STATISTICS -> DESCRIPTIVES -> tick “Save standardized values as variables”
=> there’s a new column of the standardized values at the end

Create scatter plot: LEGACY DIALOGS -> SCATTERPLOT -> SIMPLE SCATTER -> select variables on X axis & Y axis
-if you want to have the dots marked on the basis of another variable (e.g. gender)- Add variable in “Set markers by”

Calculate Pearson r: ANALYZE -> CORRELATE -> BIVARIATE

The benefits of buying summaries with Stuvia:

Guaranteed quality through customer reviews

Guaranteed quality through customer reviews

Stuvia customers have reviewed more than 700,000 summaries. This how you know that you are buying the best documents.

Quick and easy check-out

Quick and easy check-out

You can quickly pay through credit card for the summaries. There is no membership needed.

Focus on what matters

Focus on what matters

Your fellow students write the study notes themselves, which is why the documents are always reliable and up-to-date. This ensures you quickly get to the core!

Frequently asked questions

What do I get when I buy this document?

You get a PDF, available immediately after your purchase. The purchased document is accessible anytime, anywhere and indefinitely through your profile.

Satisfaction guarantee: how does it work?

Our satisfaction guarantee ensures that you always find a study document that suits you well. You fill out a form, and our customer service team takes care of the rest.

Who am I buying these notes from?

Stuvia is a marketplace, so you are not buying this document from us, but from seller elenanicule. Stuvia facilitates payment to the seller.

Will I be stuck with a subscription?

No, you only buy these notes for $4.82. You're not tied to anything after your purchase.

Can Stuvia be trusted?

4.6 stars on Google & Trustpilot (+1000 reviews)

71184 documents were sold in the last 30 days

Founded in 2010, the go-to place to buy revision notes and other study material for 14 years now

Start selling

Recently viewed by you


$4.82
  • (0)
  Add to cart