Inleiding in de Methodologie en Statistiek (6461PS014Y)
Summary
Samenvatting SPSS instructies - Introductie methoden en technieken (cijfer 9.0)
4 views 0 purchase
Course
Inleiding in de Methodologie en Statistiek (6461PS014Y)
Institution
Universiteit Leiden (UL)
Dit zijn de SPSS-instructies / stappen voor het succesvol halen van het SPSS tentamen van introductie in de methoden en technieken.
Met deze instructies heb ik eenvoudig een 9.0 gehaald.
Inleiding in de Methodologie en Statistiek (6461PS014Y)
All documents for this subject (23)
Seller
Follow
michellevanzwieten
Reviews received
Content preview
Introductie methoden en technieken - SPSS TENTAMEN
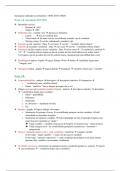
Week 3 introductie IMT SPSS
Bestanden opslaan
Bestand .SAV
Output .SPV
Definiëren van : variable view dan kun je definiëren
Labels hoe de variabele heet
Value labels de naam van de verschillende waardes van de variabele
Missing values wat de ontbrekende waarde(n) zijn
Sorteren op één variabele : Data sort cases sort by: ‘’variabele erheen slepen’’
Sorteren op meerdere variabelen : Data sort cases sort by: ‘’variabelen erheen slepen’’
Selecteren op één waarde van een variabele : Data select cases ‘’if condition is satisfied
‘’if’’ ‘’variabele erheen slepen en dan de waarde die het moet hebben juist achter zetten‘’
(vervolgens zijn de gevallen die niet bij selectie horen, doorgestreept (op tabblad data view)
Staafdiagram maken: Graphs legacy dialogs bar define variabelen slepen naar
‘’category axis’’
Histogram maken : graphs legacy dialogs histogram variabele slepen naar ‘’variable’’
Week 4
Frequentietabellen : analyze descriptive descriptive statictics frequencies
o ‘’variabele(n) naar variables slepen’’
o Onder ‘’statistics’’ kun je dingen opvragen die je wil
Dingen opvragen als (centrale tendentie dingen) : analyze descriptive statistics descriptive
‘’variabele(n) slepen naar variables’’
o Mean = gemiddelde
o Minimum
o Maximum
o St. deviation = standaard deviatie
o Etc.
Boxplot : graphs legacy dialogs boxplot
o Summaries for groups of cases verschillende groepen van één variabele leidt
uiteindelijk tot meerdere boxplots
o Summaries of separates variables leidt uiteindelijk tot één of meerder boxplots, ligt
eraan hoeveel variabelen je ‘sleept’’
Vakje variable = variabele waarvan je de boxplot wil (meetniveau = interval/ratio)
Vakje category axis = de verschillende groep(en) (meetniveau = nominaal =
categorisch)
Nieuwe variabelen maken a.d.h.v. oude variabelen : transform compute variable
In het vakje ‘’target variable’’ = naam van de nieuwe variabele
In het vakje ‘’numeric expression’’ = oude variabelen heenslepen en de juiste tekens
plaatsen (bijv. optellen van meerdere variabelen)
Overzicht van cases (=controleren of aanmaken nieuwe variabelen gelukt is) : analyze reports
case summaries ‘’variabelen slepen naar variable(s)’
The benefits of buying summaries with Stuvia:
Guaranteed quality through customer reviews
Stuvia customers have reviewed more than 700,000 summaries. This how you know that you are buying the best documents.
Quick and easy check-out
You can quickly pay through credit card or Stuvia-credit for the summaries. There is no membership needed.
Focus on what matters
Your fellow students write the study notes themselves, which is why the documents are always reliable and up-to-date. This ensures you quickly get to the core!
Frequently asked questions
What do I get when I buy this document?
You get a PDF, available immediately after your purchase. The purchased document is accessible anytime, anywhere and indefinitely through your profile.
Satisfaction guarantee: how does it work?
Our satisfaction guarantee ensures that you always find a study document that suits you well. You fill out a form, and our customer service team takes care of the rest.
Who am I buying these notes from?
Stuvia is a marketplace, so you are not buying this document from us, but from seller michellevanzwieten. Stuvia facilitates payment to the seller.
Will I be stuck with a subscription?
No, you only buy these notes for $3.90. You're not tied to anything after your purchase.