Are you struggling with IELTS Writing Task 1? Do you find it hard to describe line graphs in a clear and accurate way? Do you want to improve your score and impress the examiners with your writing skills?
Imagine being able to improve your score and leave the examiners in awe of your writing ski...
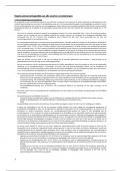
The line graph considerably elucidates the price changes of three distinct food
product groups in the United States between 1979 and 2009, as well as the overall
trend of the consumer price index during this three-decade span.
The overall of the chart represents that the prices of the three food product
groups underwent a marked increase, despite some fluctuations. A cursory
glance reveals that the prices of fresh fruits and vegetables increased significantly
more than the general consumer price index.
In the graph, it is patently clear that all the lines on the graph share the same
starting figure in 1979. The consumer price index steadily ascended from about 60
LINE GRAPH SAMPLE ANSWERS 1
, in 1979 to over 200 in 2009. The trends for sugar and sweets and carbonated drinks
were comparable. Although their prices also rose, they consistently remained
below the consumer price index average after 1987.
Fortifying further, After some minor fluctuations, the sugar and sweets figure on the
graph was 200 in 2009, surpassing the final figure for carbonated drinks at 150.
The prices of fresh fruits and vegetables saw a substantial increase, especially
after 1989. The prices began at approximately 60 and concluded at around 330 on
the index by the end of the period.
SAMPLE ANSWER 2
The graph below presents the employment patterns in the USA between 1930 and
2010.
Summarize the information by selecting and report in the main features, and make
comparisons where relevant.
Write at least 150 words.
LINE GRAPH SAMPLE ANSWERS 2
Voordelen van het kopen van samenvattingen bij Stuvia op een rij:
√ Verzekerd van kwaliteit door reviews
Stuvia-klanten hebben meer dan 700.000 samenvattingen beoordeeld. Zo weet je zeker dat je de beste documenten koopt!
Snel en makkelijk kopen
Je betaalt supersnel en eenmalig met iDeal, Bancontact of creditcard voor de samenvatting. Zonder lidmaatschap.
Focus op de essentie
Samenvattingen worden geschreven voor en door anderen. Daarom zijn de samenvattingen altijd betrouwbaar en actueel. Zo kom je snel tot de kern!
Veelgestelde vragen
Wat krijg ik als ik dit document koop?
Je krijgt een PDF, die direct beschikbaar is na je aankoop. Het gekochte document is altijd, overal en oneindig toegankelijk via je profiel.
Tevredenheidsgarantie: hoe werkt dat?
Onze tevredenheidsgarantie zorgt ervoor dat je altijd een studiedocument vindt dat goed bij je past. Je vult een formulier in en onze klantenservice regelt de rest.
Van wie koop ik deze samenvatting?
Stuvia is een marktplaats, je koop dit document dus niet van ons, maar van verkoper mayankarora2685. Stuvia faciliteert de betaling aan de verkoper.
Zit ik meteen vast aan een abonnement?
Nee, je koopt alleen deze samenvatting voor $8.49. Je zit daarna nergens aan vast.