100% satisfaction guarantee Immediately available after payment Both online and in PDF No strings attached
logo-home
Samenvatting Statistiek 2 (MAT-15403) $3.71
Add to cart

Summary

Samenvatting Statistiek 2 (MAT-15403)

5 reviews
 443 views  32 purchases
  • Course
  • Institution

In deze samenvatting is alle stof die in de werkcolleges van het vak Statistiek 2, dat gegeven wordt aan Wageningen University, aan bod komt verwerkt. Zodoende geeft deze samenvatting een volledig beeld van de stof die moet worden beheerst voor het tentamen van dit vak.

Last document update: 6 year ago

Preview 3 out of 27  pages

  • January 23, 2018
  • January 30, 2018
  • 27
  • 2017/2018
  • Summary

5  reviews

review-writer-avatar

By: ronbrug • 4 year ago

review-writer-avatar

By: timrammelaere • 4 year ago

review-writer-avatar

By: jeroengense • 5 year ago

review-writer-avatar

By: karstenkeiman • 6 year ago

review-writer-avatar

By: wesselreynierse • 6 year ago

avatar-seller
Samenvatting werkcolleges Statistiek 2
Werkcollege 1
Bij begin van statistisch onderzoek moeten altijd de volgende zaken worden gedefinieerd =
proefopzet statistisch onderzoek:
1. Onderzoeksvraag
2. Populatie: de gehele groep elementen (personen, objecten etc.) waarover informatie wordt
gewenst.
3. Steekproef: gedeelte van de populatie dat feitelijk wordt onderzocht.
4. Eenheden: de elementen van de steekproef waaraan gegevens worden verzameld. bv. mensen,
dieren
5. Variabele(n): eigenschap(pen) van de elementen uit de steekproef die worden bepaald (bv. lengte,
gewicht).
- Kwantitatieve variabelen -> getallen
1. Continu: variabele kan elke mogelijke waarde hebben. bv. lengte
2. Discreet: variabele kan slechts enkele waarden hebben, niet alle mogelijke waarden. bv. aantal
linkshandigen
- Kwalitatieve/categorische variabelen -> categorieën
1. Nominaal: variabele wordt NIET in geordende klassen gemeten. bv. haarkleur
2. Ordinaal: variabele wordt in geordende klassen gemeten. bv. hoogst genoten opleiding

Meest eenvoudige manier om steekproef uit populatie te trekken = Enkelvoudige Aselecte
Steekproef (EAS): steekproef waarbij volstrekt willekeurig een aantal eenheden uit de populatie
worden genomen.

Toevalsvariabelen/stochastische variabelen: variabelen waarvan de uitkomst (in bepaalde mate)
door toeval wordt bepaald. -> altijd aangeduid met hoofdletter

Visualisatie variabelen:
1. Kwantitatieve continue variabelen + kwantitatieve discrete variabelen met groot aantal mogelijke
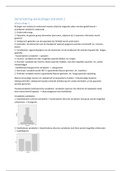
uitkomsten -> histogram:


2. Kwalitatieve variabelen + kwantitatieve discrete variabelen met klein aantal mogelijke uitkomsten
-> staafdiagram:

,Hoe meer waarnemingen gedaan worden, hoe kleiner klassebreedte van histogram moet worden
gemaakt. -> oneindig groot aantal waarnemingen en dus oneindig kleine klassebreedte? -> histogram
wordt curve (kansdichtheidsfunctie)


Kans (P): relatieve frequentie op de lange termijn.
P(A) = de kans op A.

P(A) = oppervlakte onder kansdichtheidsfunctie boven A.


Totale kans = 1 -> totale oppervlakte onder kansdichtheidsfunctie = 1

Normale verdeling:
1. Formule:


2. Grafiek:


Kenmerken normale verdeling:
- Symmetrisch
- Eéntoppig/unimodaal
- Klokvormig

Notatie normale verdeling:

“variabele y is verdeeld als een normale verdeling (N) met populatiegemiddelde/verwachting μ en
populatiestandaardafwijking/populatiestandaarddeviatie σ”

, Standaard normale verdeling: normale verdeling met
populatiegemiddelde/verwachting (μ) van 0 en
populatiestandaarddeviatie/populatiestandaardafwijking (σ) van 1.
Notatie:


Gebruik van tabel standaard normale verdeling (Table 1 O&L):


Continue verdeling (bv. normale verdeling)?
Kans op precies één bepaalde waarde = 0 -> gevolg: P(Z ≤ z) = P(Z < z), dus
P(Z ≥ z) = P(Z > z) = 1 - P(Z ≤ z) = 1 - P(Z < z)
P(z1 ≤ Z ≤ z2) = P(z1 < Z < z2) = P(Z ≤ z2) – P(Z ≤ z1) = P(Z < z2) – P(Z < z1)
Discrete verdeling (bv. binomiale verdeling)?
Kans op precies één bepaalde waarde ≠ 0 -> gevolg: P(Z ≤ z) ≠ P(Z < z), dus
P(Z ≥ z) = 1 - P(Z ≤ z - 1)
P(Z > z) = 1 - P(Z ≤ z)
P(z1 ≤ Z ≤ z2) = P(Z ≤ z2) – P(Z ≤ z1 - 1)
P(z1 < Z < z2) = P(Z < z2) – P(Z ≤ z1)

Transformatie van normale verdeling naar standaard normale verdeling:
- Nodig om Table 1 in boek O&L te kunnen gebruiken
- Te gebruiken formule:

The benefits of buying summaries with Stuvia:

Guaranteed quality through customer reviews

Guaranteed quality through customer reviews

Stuvia customers have reviewed more than 700,000 summaries. This how you know that you are buying the best documents.

Quick and easy check-out

Quick and easy check-out

You can quickly pay through credit card or Stuvia-credit for the summaries. There is no membership needed.

Focus on what matters

Focus on what matters

Your fellow students write the study notes themselves, which is why the documents are always reliable and up-to-date. This ensures you quickly get to the core!

Frequently asked questions

What do I get when I buy this document?

You get a PDF, available immediately after your purchase. The purchased document is accessible anytime, anywhere and indefinitely through your profile.

Satisfaction guarantee: how does it work?

Our satisfaction guarantee ensures that you always find a study document that suits you well. You fill out a form, and our customer service team takes care of the rest.

Who am I buying these notes from?

Stuvia is a marketplace, so you are not buying this document from us, but from seller hugocloudt. Stuvia facilitates payment to the seller.

Will I be stuck with a subscription?

No, you only buy these notes for $3.71. You're not tied to anything after your purchase.

Can Stuvia be trusted?

4.6 stars on Google & Trustpilot (+1000 reviews)

59804 documents were sold in the last 30 days

Founded in 2010, the go-to place to buy study notes for 15 years now

Start selling
$3.71  32x  sold
  • (5)
Add to cart
Added