chapter 1 introduction
probability → deductive; how likely is a certain outcome
statistics → inductive; what can we say abt the population
» descriptive: summarizes sample/population data with numbers/tables/graphs
» inferential: generates predictions abt population parameters, based on sample data
rq and data
- population: total group of ppl relevant for the rq
- sample: part of population participating in data collection
reliable reliable reliable reliable
valid valid valid valid
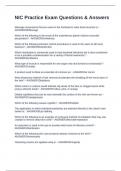
- reliability: consistency of measures
» test-retest: two measurements of the same behavior at different times
» interrater: different observers measuring the same behavior
» internal consistency: interrelation of individual items of a measuring instrument
- validity: how accurately it measures what it’s supposed to measure
chapter 2 sampling and measurement
variable: observed trait that differs between subjects
» behavioral; stimulus; subject; physiological
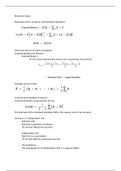
measurement levels → noir
- nominal: no order in categories
qualitative
- ordinal: order in categories
- interval: equal distance between values
quantitative
- ratio: equal distance and absolute zero
discrete variables: finite set of possible values (whole numbers)
continuous variables: infinite set of possible values (decimals)
problems:
- sampling bias: natural sampling variation
» volunteer sampling → only volunteers as participants
» selection bias → only one type of participant
» under coverage → lack of representation for some groups
- response bias: bad context in which questions (or answers) are given
- non-response bias: unanswered questions resulting in missing data
- sampling error: uncertainty abt just observing a sample
solution? random sampling approach of sufficient size that generates data for everyone approached
1
, sampling methods:
- simple random sampling
» every combination has the same chance of being a sample
» feasible when all participants from the population are approachable
- systematic random sampling
» not every combo has an equal chance 𝑘: skip number
» simple; often good representation of the population 𝑁: population size
» 𝑘 =𝑁/𝑛 𝑛: sample size
- stratified random sampling
» a-priori explicit groups that are compared
» within each group (=stratum) a sample is drawn
» (dis)proportional
o proportional: sampled strata proportions are the same as in the population
o disproportional: sampled strata proportions differ from the population
» useful for comparing different sized groups
- cluster sampling
» not every combination has an equal chance
» useful when it’s unfeasible to approach participants from all clusters
- multi-stage sampling
» multiple sequential stages of random sampling
» combination of the first 4 methods
chapter 3 descriptive statistics
central tendency measures:
∑𝑦𝑖
- mean: 𝑦̅ = 𝑛
- median → middle observation in ordered samples
- mode → most frequent observation
∑(𝑦𝑖−𝑦̅)2
standard deviation: 𝑠 = √ 𝑛−1
» always a positive number
» the greater the variability abt the mean
- sum of squares: 𝑠𝑠 = ∑(𝑦𝑖 − 𝑦̅)2 → (𝑦1 − 𝑦̅)1 + (𝑦2 − 𝑦̅)2 + ⋯ + (𝑦𝑛 − 𝑦̅)2
2 𝑠𝑠
- variance: 𝑠 =
𝑛−1
- standard deviation is the square root of the variance: 𝑠 = √𝑠 2
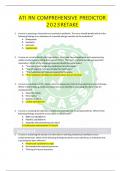
empirical rule for normal distribution:
- 68% within ± 1𝜎 of the mean
- 95% within ± 1.96𝜎 of the mean
- 99% within ± 3𝜎 of the mean
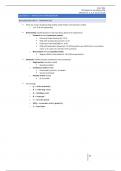
percentile: 𝑝% of the observations fall below or at that point and (100 − 𝑝)% falls above it
- 25th percentile → lower quartile
- 75th percentile → upper quartile
2
probability → deductive; how likely is a certain outcome
statistics → inductive; what can we say abt the population
» descriptive: summarizes sample/population data with numbers/tables/graphs
» inferential: generates predictions abt population parameters, based on sample data
rq and data
- population: total group of ppl relevant for the rq
- sample: part of population participating in data collection
reliable reliable reliable reliable
valid valid valid valid
- reliability: consistency of measures
» test-retest: two measurements of the same behavior at different times
» interrater: different observers measuring the same behavior
» internal consistency: interrelation of individual items of a measuring instrument
- validity: how accurately it measures what it’s supposed to measure
chapter 2 sampling and measurement
variable: observed trait that differs between subjects
» behavioral; stimulus; subject; physiological
measurement levels → noir
- nominal: no order in categories
qualitative
- ordinal: order in categories
- interval: equal distance between values
quantitative
- ratio: equal distance and absolute zero
discrete variables: finite set of possible values (whole numbers)
continuous variables: infinite set of possible values (decimals)
problems:
- sampling bias: natural sampling variation
» volunteer sampling → only volunteers as participants
» selection bias → only one type of participant
» under coverage → lack of representation for some groups
- response bias: bad context in which questions (or answers) are given
- non-response bias: unanswered questions resulting in missing data
- sampling error: uncertainty abt just observing a sample
solution? random sampling approach of sufficient size that generates data for everyone approached
1
, sampling methods:
- simple random sampling
» every combination has the same chance of being a sample
» feasible when all participants from the population are approachable
- systematic random sampling
» not every combo has an equal chance 𝑘: skip number
» simple; often good representation of the population 𝑁: population size
» 𝑘 =𝑁/𝑛 𝑛: sample size
- stratified random sampling
» a-priori explicit groups that are compared
» within each group (=stratum) a sample is drawn
» (dis)proportional
o proportional: sampled strata proportions are the same as in the population
o disproportional: sampled strata proportions differ from the population
» useful for comparing different sized groups
- cluster sampling
» not every combination has an equal chance
» useful when it’s unfeasible to approach participants from all clusters
- multi-stage sampling
» multiple sequential stages of random sampling
» combination of the first 4 methods
chapter 3 descriptive statistics
central tendency measures:
∑𝑦𝑖
- mean: 𝑦̅ = 𝑛
- median → middle observation in ordered samples
- mode → most frequent observation
∑(𝑦𝑖−𝑦̅)2
standard deviation: 𝑠 = √ 𝑛−1
» always a positive number
» the greater the variability abt the mean
- sum of squares: 𝑠𝑠 = ∑(𝑦𝑖 − 𝑦̅)2 → (𝑦1 − 𝑦̅)1 + (𝑦2 − 𝑦̅)2 + ⋯ + (𝑦𝑛 − 𝑦̅)2
2 𝑠𝑠
- variance: 𝑠 =
𝑛−1
- standard deviation is the square root of the variance: 𝑠 = √𝑠 2
empirical rule for normal distribution:
- 68% within ± 1𝜎 of the mean
- 95% within ± 1.96𝜎 of the mean
- 99% within ± 3𝜎 of the mean
percentile: 𝑝% of the observations fall below or at that point and (100 − 𝑝)% falls above it
- 25th percentile → lower quartile
- 75th percentile → upper quartile
2