In this document every video on Brightspace for the course Statistics MAN-MOR004 is completely written down (video 1-23). Every single sentence including every example with the use of colors and shapes is elaborated on. The full credits go to Eric Jacobs of the Radboud University for providing the ...
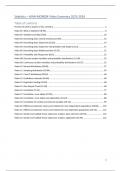
Table of contents
Preview of what to expect in this summary ............................................................................................ 2
Video 01. What is Statistics? (8:39) ......................................................................................................... 8
Video 02. Variables and data (9:29) ...................................................................................................... 10
Video 03. Describing data: Central tendency (15:05)............................................................................ 12
Video 04. Describing data: Dispersion (16:32) ...................................................................................... 14
Video 05. Describing data: Dispersion interpretation and shape (21:12) ............................................. 17
Video 06. Describing data: Relative position (5:35) .............................................................................. 21
Video 07. Probability and frequencies (8:52) ........................................................................................ 22
Video 08. Discrete random variables and probability distributions (11:59) ......................................... 23
Video 09. Continuous random variables and probability distributions (10:37) .................................... 25
Video 10. Normal distribution (28:40) .................................................................................................. 27
Video 11. Sampling distribution (19:04) ................................................................................................ 34
Video 12. Z and T distribution (38:52) ................................................................................................... 38
Video 13. Confidence Intervals (36:46) ................................................................................................. 48
Video 14. Hypothesis testing (33:16) .................................................................................................... 60
Video 15. One Sample T-test (31:18) ..................................................................................................... 69
Video 16. Correlation (7:32) .................................................................................................................. 77
Video 17. Correlation: cross tables (27:02) ........................................................................................... 80
Video 18. Correlation: cross tables and elaboration (21:47) ................................................................. 88
Video 19. Correlation for ordinal and interval variables (25:14) ........................................................... 95
Video 20. Differences between means and medians for two independent populations (19:03) ....... 107
Video 21. Differences between means and medians for two dependent populations (15:15) .......... 112
Video 22. Simple and multiple linear regression analysis: basic elements (16:54) ............................. 116
Video 23. Simple and multiple linear regression analysis: application (23:45) ................................... 122
1
,Preview of what to expect in this summary
This is the last video and the final example:
Example 2 on simple and multiple linear regression analysis
Example 2: multiple linear regression analysis
Research question 1:
To what extent do social status and cultural lifestyle of parents determine cultural lifestyle?
Hypothesis
The higher the social status and the more pronounced the cultural lifestyle of the parents,
therefore the more pronounced someone’s cultural lifestyle.
Conceptual model
Social status Cultural lifestyle
Cultural lifestyle parents
We have two independent variables (social status + cultural lifestyle parents) and we want to know
to what extend they determine the cultural lifestyle. The independent variables have a positive
effect on cultural lifestyle, this is a causal effect therefore a one-sided arrow. We expect a positive
influence, therefore the plusses.
Collection and analysis of data
1. What is the research question?
In this case we have explanatory question, it is also a static question. We don’t have any
time-length involved here, there is no dynamic part. We have a question whether two
independent variables (social status and cultural lifestyle of the parents determine
someone’s cultural lifestyle. Determine means that we want to explain the differences in
cultural lifestyle.
2. What is the measurement level of my variables?
We saw that social status and cultural lifestyle are of interval measurement level. We only
have to check what type of variable the cultural lifestyle of the parents is.
2
, Cultural lifestyle of the parents ranges from 4 up and till 20. The cultural lifestyle is a
combination of 4 questions are put together in one scale.
We can treat cultural lifestyle of the parents as an interval variable. All the variables, the
dependent and independent variables should be of interval measurement level. This
criteria is met!
3. Are there relationships between variables involved?
In this case, the causal relation is involved. This is because of the research question that
was stated as: to what extend does social status and cultural lifestyle of parents determine
cultural lifestyle? Determine means that there is a causal relation involved.
4. Are there any criteria for the analysis techniques?
As said before, both variables should be of interval level. That criteria is met for this one.
Part 1: F-test
SPSS calculations
To start off we do the general F-test and see
what is the result of that. It is in the table anova
(Analysis of Variances). The regression model
has an F-value of 139.656 with a significance
level of .000. You can see that the predictors are
cultural lifestyle of the parents and social status.
The dependent variable is cultural lifestyle.
F-test
What do the results mean for our test? Well, the F-test tests whether or not all independent
variables have a regression coefficient that is equal to 0 or at least 1 regression coefficient is not
equal to 0.
Hypothesis:
• H0 : 𝛽1 = 𝛽2 = 0
The null hypothesis is that all independent variables have a regression coefficient of 0
• H1 : at least 1 𝛽 ≠ 0
The alternative hypothesis is that at least 1 independent variable is different from 0
Data:
a = .05 (5%) → we choose an alpha of 5%
Critical value:
p < .05 → my critical value is p is smaller than .05
Test statistic / results:
F = 139.656 → test value of F
p = .000 → test value of p
3
, Decision:
Decision = H0 is rejected at a = .05
Why am I allowed to reject the null hypothesis? We are allowed to reject when the observed p
value is smaller ( < ) than my critical value. This is the case here because .000 (observed) is smaller
than .05 (critical).
Conclusion
There is an indication that at least 1 regression coefficient is deviant (afwijkend) from 0
Part 2: Significance test regression coefficient(s)
SPSS calculations
The test for the regression coefficient(s) is in
this box. Here you can see that there are three
elements:
• Constant = 𝛽0 or the intercept (when
comparing it with the regression equation.
This is where the plain cuts the Y-axis.
• We have the effect of social status
• We have the effect of cultural lifestyle of
parents
We ignore the constant and we are going to
check the social status and cultural lifestyle of
parents effects.
We have the unstandardized regression
coefficients. Next to that is the standard errors
attached. We also have the standardized
coefficient. We also have the t-values and the
attached significance levels.
Same picture for reference
Test of significance (example for one of the two predictors)
What does the information above mean for our test of significance? In this example only one of the
two predictors (cultural lifestyle of parents) is discussed, but the procedure for both is the same.
Hypothesis
• H0 : 𝛽2 = 0
The null hypothesis is that the regression coefficient for cultural lifestyle of parents is 0
• H1 : 𝛽2 > 0
The alternative hypothesis is that the regression coefficient for cultural lifestyle of parents is
bigger than 0. This is because we hypothesized a positive effect.
Data:
a = .05 (5%) → we choose an alpha of 5%
df = n – (k+1) = 1024 – 3 =1021 → The degrees of freedom is the number of respondents minus the
number of parameters that you estimate (k number of independent variables in this case 2 and we
have 1 constant to estimate which makes 3). Sometimes you need the degrees of freedom so it is
stated here.
Critical value:
ta = 1.645 → t for alpha one-sided is 1.645 on the positive side
4
The benefits of buying summaries with Stuvia:
Guaranteed quality through customer reviews
Stuvia customers have reviewed more than 700,000 summaries. This how you know that you are buying the best documents.
Quick and easy check-out
You can quickly pay through credit card or Stuvia-credit for the summaries. There is no membership needed.
Focus on what matters
Your fellow students write the study notes themselves, which is why the documents are always reliable and up-to-date. This ensures you quickly get to the core!
Frequently asked questions
What do I get when I buy this document?
You get a PDF, available immediately after your purchase. The purchased document is accessible anytime, anywhere and indefinitely through your profile.
Satisfaction guarantee: how does it work?
Our satisfaction guarantee ensures that you always find a study document that suits you well. You fill out a form, and our customer service team takes care of the rest.
Who am I buying these notes from?
Stuvia is a marketplace, so you are not buying this document from us, but from seller Bram3108. Stuvia facilitates payment to the seller.
Will I be stuck with a subscription?
No, you only buy these notes for $10.79. You're not tied to anything after your purchase.