100% satisfaction guarantee Immediately available after payment Both online and in PDF No strings attached
logo-home
Research Methodology and Descriptive Statistics - Test 1 - Notes 2/2 - GRADE: 8.5 $9.70
Add to cart

Class notes

Research Methodology and Descriptive Statistics - Test 1 - Notes 2/2 - GRADE: 8.5

 21 views  0 purchase
  • Course
  • Institution
  • Book

This is 2/2 of my EXTENSIVE notes for Test 1 for the pre-master course Research Methodology and Descriptive Statistics on the University of Twente. With these notes, and the first part, you have a good knowledge to pass the first exam. I passed my exam with a 8.5! These notes consists of units 8 -...

[Show more]
Preview 3 out of 61  pages

  • January 12, 2024
  • 61
  • 2022/2023
  • Class notes
  • Henk van der kolk
  • Unit 8 - 11, 13, 23, 24 + spss unit 3 + q&a sessions
avatar-seller
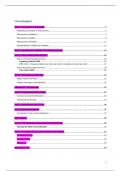
Inhoudsopgave
Unit 8 – Two aspects of data quality ............................................................................................................ 2
Reliability and validity in measurement .............................................................................................................. 2
Measurement reliability ....................................................................................................................................... 5
Measurement validity .......................................................................................................................................... 9
Measurement reliability ..................................................................................................................................... 11
Standardization, validity and reliability ............................................................................................................. 11

Notes – introduction in reliability and validity assessment ......................................................................... 12

SPSS3 – How to display data using SPSS..................................................................................................... 16
Part A. Univariate analysis (Unit 9).................................................................................................................... 16
Frequency tables in SPSS.............................................................................................................................. 16
SPSS Unit 3 – Frequency tables, bar chart, pie chart, & multiple or cluster bar chart ................................. 17
Part B. Bivariate analysis (Unit 13) .................................................................................................................... 20
Cross tabs in SPSS ......................................................................................................................................... 20

Unit 9 – Displaying univariate data ............................................................................................................ 22
Mode, median and mean ................................................................................................................................... 22
Graphs and shapes of distributions ................................................................................................................... 22

Q&A Week 3 – 24 september .................................................................................................................... 25

Unit 10 – Summarizing ratio variables ....................................................................................................... 31
Variance and standard deviation ....................................................................................................................... 31
Introducing the boxplot ..................................................................................................................................... 32

Unit 11 – Distributions and Z-scores .......................................................................................................... 36

Unit 23 – Normal distribution.................................................................................................................... 37
Introduction to the normal distribution ............................................................................................................. 37

Q&A – Week 4 .......................................................................................................................................... 40

Unit 13 – Visualizing and analyzing bivariate relationships ......................................................................... 50
Contingency tables and scatterplots ................................................................................................................ 50

Unit 24 – Describing the association between two variables....................................................................... 51
Spearman’s p (rho)............................................................................................................................................. 53
Kendall’s T (tau) ................................................................................................................................................. 53
Pearson’s R ......................................................................................................................................................... 53

Q&A Session 7/10..................................................................................................................................... 55


1

,Unit 8 – Two aspects of data quality
Reliability and validity in measurement
Assessing operationalization & measurement
Even when we observe the right set of units, observation may be imperfect: we make
mistakes

Two types of observation mistakes:
- Random errors (can be anything and happen accidentally)
- Systematic errors (happens systematic. Two categories: systematic bias or measuring
the wrong construct)

Two different ways of assessing an operationalization (quality of measurement instruments):
1. Measurement reliability = the absence of random error
2. Measurement validity = no systematic error, (on average) measure what you intend to
measure (= on average we measure what we want to measure)

Example
Operationalize ‘weight’ using a scale;
Every individual steps on the scale 10 times;
Use three different scales (= three operationalizations);
Assess the operationalization using the reliability


→ since this happens at the same time more or less, we can argue the scale is not reliable


→ smaller differences than the first scale (see picture of ‘scale 1’), so somewhat reliable


2

, Measurement validity
The operationalization may be ‘reliable’…. But is it also correct (valid, unbiased)?


→ true weight says 77 kilos, but reliable weight says 80 kilos. So this reliable, but not valid!


Assessing measurement validity
Validity of an operationalization cannot be observed directly, because the ‘true’ value is
unknown…

Three approaches to measurement validity:
- Content validity
- Criterion validity
- Construct validity

Content validity
Does it cover all aspects of the concept?


3

The benefits of buying summaries with Stuvia:

Guaranteed quality through customer reviews

Guaranteed quality through customer reviews

Stuvia customers have reviewed more than 700,000 summaries. This how you know that you are buying the best documents.

Quick and easy check-out

Quick and easy check-out

You can quickly pay through credit card or Stuvia-credit for the summaries. There is no membership needed.

Focus on what matters

Focus on what matters

Your fellow students write the study notes themselves, which is why the documents are always reliable and up-to-date. This ensures you quickly get to the core!

Frequently asked questions

What do I get when I buy this document?

You get a PDF, available immediately after your purchase. The purchased document is accessible anytime, anywhere and indefinitely through your profile.

Satisfaction guarantee: how does it work?

Our satisfaction guarantee ensures that you always find a study document that suits you well. You fill out a form, and our customer service team takes care of the rest.

Who am I buying these notes from?

Stuvia is a marketplace, so you are not buying this document from us, but from seller Jhamel. Stuvia facilitates payment to the seller.

Will I be stuck with a subscription?

No, you only buy these notes for $9.70. You're not tied to anything after your purchase.

Can Stuvia be trusted?

4.6 stars on Google & Trustpilot (+1000 reviews)

56326 documents were sold in the last 30 days

Founded in 2010, the go-to place to buy study notes for 14 years now

Start selling
$9.70
  • (0)
Add to cart
Added