100% satisfaction guarantee Immediately available after payment Both online and in PDF No strings attached
logo-home
An absolute guide for Excel crash course $8.49   Add to cart

Exam (elaborations)

An absolute guide for Excel crash course

 1 view  0 purchase
  • Course
  • Institution

This is an absolute super quide for Excel crash course Learn all the tips, tricks, shortcuts, functions and formulas you need to be an Excel power user. This guide is designed specifically for Excel users who are performing professional financial analysis and financial modeling. We cover all levels...

[Show more]
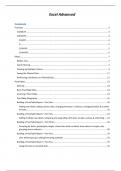
Preview 4 out of 44  pages

  • January 20, 2024
  • 44
  • 2023/2024
  • Exam (elaborations)
  • Questions & answers
avatar-seller
Excel Advanced

Contents
Formulas ....................................................................................................................................................... 3
VLOOKUP................................................................................................................................................... 3
COUNTIFS .................................................................................................................................................. 4
COUNT................................................................................................................................................... 4
IF ............................................................................................................................................................ 5
COUNTIF ................................................................................................................................................ 5
COUNTIFS .............................................................................................................................................. 6
Filters............................................................................................................................................................. 7
Ribbon Tour............................................................................................................................................... 7
Quick Filtering ........................................................................................................................................... 7
Filtering by Multiple Criteria ..................................................................................................................... 9
Saving the Filtered Data .......................................................................................................................... 11
Performing Calculations on Filtered Data ............................................................................................... 12
PivotTables .................................................................................................................................................. 13
Defined.................................................................................................................................................... 13
Basic PivotTable Data .............................................................................................................................. 14
Inserting a Pivot Table............................................................................................................................. 14
PivotTable Geography ............................................................................................................................. 15
Building a PivotTable Report – Part One................................................................................................. 16
Adding row labels, adding column data, changing formulas in columns, changing headers & number
formats ................................................................................................................................................ 16
Building a PivotTable Report – Part Two ................................................................................................ 24
Adding multiple row labels, collapsing and expanding, drill down to data, sorting, & refreshing ..... 24
Building a PivotTable Report – Part Three .............................................................................................. 26
Grouping by dates, grouping by ranges, show items with no detail, show values in empty cells,
grouping across columns .................................................................................................................... 26
Building a PivotTable Report – Part Four ................................................................................................ 33
User defined groups, adding/removing subtotals .............................................................................. 33
Building a PivotTable Report – Part Five ................................................................................................. 35
Using formulas on pivoted data .......................................................................................................... 35

,Building a PivotTable Report – Part Six ................................................................................................... 37
Displaying multiple row labels in columns, or tabular form. .............................................................. 37
Other Cool Things to do with a Pivot Table – Part Seven ....................................................................... 39
Report Filters....................................................................................................................................... 39
Report Slicers ...................................................................................................................................... 40
Expanding Filter Results to Individual Tabs ........................................................................................ 41
Formatting as a Table - Part Eight ........................................................................................................... 41


2

,Formulas
VLOOKUP
The VLOOKUP function searches vertically (top to bottom) the leftmost column of a table until a value that
matches or exceeds the one you are looking up is found.

The elements being looked up must be unique and must be arranged or sorted in ascending order; that is,
alphabetical order for text entries, and lowest-to-highest order for numeric entries.

The syntax is =VLOOKUP(lookup_value,table_array,col_index_num,[range_lookup]).

An example of the formula is: VLOOKUP(E2,D2:M3,2,TRUE) The English translation is using the value found in the
cell E2, look in the range of D2 to M3 row by row. If you find a value that matches or exceeds the value in E2,
using that row, go over 2 columns to the right, grab the value there and bring it back.

There are two range_lookup argument options; TRUE or FALSE

TRUE

Is the default answer, so you may leave it out of the formula

Looks for an approximate match

If it finds an exact match it will use it.

If it doesn’t find an exact match, it will use the last item before it got greater

Alphabetical: Looking for Cat. If elements are Apple, Bird, Carpet, Dog; then Carpet
would be returned because Dog exceeds Cat alphabetically.

Numeric: Looking for 5.25. If elements are 3.0, 4.0, 5.0, 6.0, 7.0, then 5.0 would be used.
The last number before 5.25 was exceeded.

FALSE

Looks for an exact match.

If it finds an exact match it will use it.

If it doesn’t find an exact match, it will return #N/A

Alphabetical: Looking for Cat. If elements are Apple, Bird, Carpet, Dog; then #N/A would
be returned.

Numeric: Looking for 5.25. If elements are 3.0, 4.0, 5.0, 6.0, 7.0, then #N/A would be
returned because there is no exact match.


3

, COUNTIFS
Recall quickly the COUNT and IF commands.

COUNT
The COUNT function counts the number of cells that contain numbers and counts numbers within the
list of arguments.

The syntax is COUNT( value1, value2, …)

Continuing on with our SUM formula from above, let’s not only add up the values of the range A1:A4,
but let’s count how many numbers are included within the range, i.e. how many cells within the range
has a value in it.

The formula is =COUNT(A1:A4). The English translation is count how many cells within the range has a
value in it and display the result.


Notice that the range is exactly the same as our
SUM, A1:A4, which includes four rows. The value
returned in cell A7 is three, because only three of
the four rows have values in them.


4

The benefits of buying summaries with Stuvia:

Guaranteed quality through customer reviews

Guaranteed quality through customer reviews

Stuvia customers have reviewed more than 700,000 summaries. This how you know that you are buying the best documents.

Quick and easy check-out

Quick and easy check-out

You can quickly pay through credit card or Stuvia-credit for the summaries. There is no membership needed.

Focus on what matters

Focus on what matters

Your fellow students write the study notes themselves, which is why the documents are always reliable and up-to-date. This ensures you quickly get to the core!

Frequently asked questions

What do I get when I buy this document?

You get a PDF, available immediately after your purchase. The purchased document is accessible anytime, anywhere and indefinitely through your profile.

Satisfaction guarantee: how does it work?

Our satisfaction guarantee ensures that you always find a study document that suits you well. You fill out a form, and our customer service team takes care of the rest.

Who am I buying these notes from?

Stuvia is a marketplace, so you are not buying this document from us, but from seller avrahul. Stuvia facilitates payment to the seller.

Will I be stuck with a subscription?

No, you only buy these notes for $8.49. You're not tied to anything after your purchase.

Can Stuvia be trusted?

4.6 stars on Google & Trustpilot (+1000 reviews)

73314 documents were sold in the last 30 days

Founded in 2010, the go-to place to buy study notes for 14 years now

Start selling
$8.49
  • (0)
  Add to cart