100% satisfaction guarantee Immediately available after payment Both online and in PDF No strings attached
logo-home
Summary SPSS notes Causal Analysis Techniques (MTO-C) 2024 $6.98
Add to cart

Summary

Summary SPSS notes Causal Analysis Techniques (MTO-C) 2024

 12 views  0 purchase
  • Course
  • Institution

Hello everyone! This bundle has everything you need for SPSS at MTO-C (Techniques for Causal Analysis) at Tilburg University. This includes all the practice assignments, plus the answers to the 2022 and 2023 SPSS exams. With this bundle, I hope you can complete this part with a PASS. Good luck! ...

[Show more]
Preview 2 out of 6  pages

  • January 21, 2024
  • 6
  • 2023/2024
  • Summary
avatar-seller
Rubi Luneta
2081276
Tilburg University


SPSS
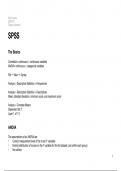
The Basics

Correlation: continuous + continuous variables
ANOVA: continuous + categorical variables

File → New → Syntax

Analyze > Descriptive Statistics > Frequencies

Analyze > Descriptive Statistics > Descriptives
Mean, standard deviation, minimum score, and maximum score

Analyze > Compare Means
Dependent list Y
Layer 1 of 1 X


ANOVA

The assumptions of an ANOVA are:
⁃ Correct measurement level of the X and Y variables
⁃ Normal distribution of scores on the Y variable (for the full dataset, and within each group)
⁃ No outliers
1

, ⁃ Approximately equal variances in all the groups
⁃ The observations should be independent (within- and between groups)

The normality assumption of the Y variable
Graphs > Legacy Dialogs > Histogram > Display normal curve
Variable box Y
Columns box X

Analyze > Compare Means > One-Way ANOVA > Options > Homogeneity of variance test
Dependent list Y
Factor X
The value of the F statistic
The signi cance value of the Levene Statistic

Levene Statistic
Sig.


Pearson Correlation

Since both of these variables are continuous, a suitable approach would be to investigate whether these two variables are
linearly related through a correlation.
We use histograms to check whether the assumption of normality is met and scatter plots to spot (bivariate) outliers.

The assumptions of a correlation are:
⁃ No bivariate outliers

Graphs > Legacy Dialog > Scatter/Dot… > Choose Simple Scatter > Click De ne

Analyze > Correlate > Bivariate
The signi cance of the association
2


fi fi

The benefits of buying summaries with Stuvia:

Guaranteed quality through customer reviews

Guaranteed quality through customer reviews

Stuvia customers have reviewed more than 700,000 summaries. This how you know that you are buying the best documents.

Quick and easy check-out

Quick and easy check-out

You can quickly pay through credit card or Stuvia-credit for the summaries. There is no membership needed.

Focus on what matters

Focus on what matters

Your fellow students write the study notes themselves, which is why the documents are always reliable and up-to-date. This ensures you quickly get to the core!

Frequently asked questions

What do I get when I buy this document?

You get a PDF, available immediately after your purchase. The purchased document is accessible anytime, anywhere and indefinitely through your profile.

Satisfaction guarantee: how does it work?

Our satisfaction guarantee ensures that you always find a study document that suits you well. You fill out a form, and our customer service team takes care of the rest.

Who am I buying these notes from?

Stuvia is a marketplace, so you are not buying this document from us, but from seller rubiluneta. Stuvia facilitates payment to the seller.

Will I be stuck with a subscription?

No, you only buy these notes for $6.98. You're not tied to anything after your purchase.

Can Stuvia be trusted?

4.6 stars on Google & Trustpilot (+1000 reviews)

52510 documents were sold in the last 30 days

Founded in 2010, the go-to place to buy study notes for 14 years now

Start selling
$6.98
  • (0)
Add to cart
Added