Casus 2
Onderzoeksvraag 1: Ritueel gedrag wordt meer beïnvloed door responspreventie alleen
dan door exposure in vivo alleen.
Opdracht 1
Onderzoeksvraag 1 gaat over ritueel gedrag.
Met welke vragenlijst is dit gemeten?
Gebruikte vragenlijst is Mauldsly Obsessive-Compulsive Inventory (MOC(I)).
Welke variabelen in het databestand bevatten dne scores hiervan?
Variabelen moc1, moc 2 en moc 3 in databestand bevatten de scores van deze vragenlijst.
Aangezien er drie variabelen zijn met scores van de vragenlijst, kun je je afvragen of dit nu
drie subschaalscores zijn van één meting of drie totaalscores van in tijd herhaalde metingen.
Zoek op (in deze tekst en elders) of deze vragenlijst subschalen heeft en in hoeverre het
gebruikelijk is om een totaalscore te gebruiken. Beredeneer vervolgens wat vermoedelijk de
inhoud van de variabelen in het bestand is.
Moc1, moc2 en moc 3 zijn respectievelijk voor-, na-, en vervolgmeting. Er zijn wel subschalen in de
test, maar dit zijn er vier. De scores in het bestand zijn elk totaalscores de vier subschalen per
tijdsmoment.
Beredeneer vervolgens wat vermoedelijk de inhoud van de variabelen in het bestand is.
Ppn = proefpersoon
Cond = conditie
VSA = obsessieve angst gemeten door Anxiety Discomfort Scale (tijdstippen), 5 angst situaties
MOC = ritueel gedrag gemeten door MOCI
Dep = depressiviteit via Hamilton Depression Scale
Ang = angst (algemene angst)
RI 1-28 = relationship inventory, oftewel kwaliteit therapeutische relatie.
De inhoud van deze variabelen zijn totaalscores.
Opdracht 2
Gebruik bij deze opdracht alleen de metingen 1 en 3, en daarnaast de variabele conditie.
Beantwoord onderzoeksvraag 1 met een t-toets. Dit kan op twee manieren. Doe ze allebei.
Schrijf over beide analyses een beknopt rapport.
Design:
AV: verschilscore (nameting – voormeting) OF moc3
OV: conditie (exposure = 1 en responsepreventie = 2)
Voor verschilscore:
Transform → Compute Variable → Target Variable: verschilscore → Numeric expression: moc3 –
moc 1 → OK
Analyze → Compare Means → Independent-Samples T Test → Test Variables: verschilscore →
Grouping Variable: condition → Define Groups: used specified values … group 1 = 1 (exposure) en
group 2 = 2 (responsepreventie) → continue → Ok.
Output:
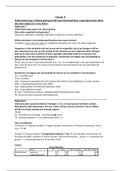
Group Statistics
cond N Mean Std. Deviation Std. Error Mean
Verschilscore exposure 30 -1,93 1,911 ,349
responspreventie 30 -4,57 2,359 ,431
, Independent Samples Test
Levene's Test
for Equality of
Variances t-test for Equality of Means
95%
Confidence
Sig. Interval of the
(2- Mean Std. Error Difference
F Sig. t df tailed) Difference Difference Lower Upper
Verschilscore Equal
variances 2,918 ,093 4,751 58 ,000 2,633 ,554 1,524 3,743
assumed
Equal
variances not 4,751 55,602 ,000 2,633 ,554 1,523 3,744
assumed
Conclusie: kijk in de tabel Independent Samples Test en dan op de regel van ‘equal variances not
assumed’, daar vindt men t(58) = -4.751, p<.001. Dit houdt dus in dat er een verschil zit in
behandelmethoden bij ritueel gedrag. In de tabel Group Statistics wordt weergegeven dat exposure
een kleinere verschilscore dan responsepreventie, wat inhoudt dat responsepreventie het rituele
gedrag meer beïnvloed.
Voor moc3:
Analyze → Compare Means → Independent-Samples T Test → Test Variables: moc3 → Grouping
Variable: condition → Define Groups: used specified values … group 1 = 1 en group 2 =2 → continue
→ Ok
Output:
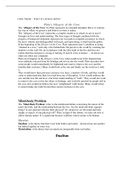
Group Statistics
cond N Mean Std. Deviation Std. Error Mean
compulsive behaviour 3 exposure 30 6,93 1,507 ,275
responspreventie 30 4,30 1,208 ,221
Independent Samples Test
Levene's Test
for Equality of
Variances t-test for Equality of Means
95%
Confidence
Sig. Interval of the
(2- Mean Std. Error Difference
F Sig. t df tailed) Difference Difference Lower Upper
compulsive Equal
behaviour 3 variances 1,049 ,310 7,468 58 ,000 2,633 ,353 1,928 3,339
assumed
Equal
variances not 7,468 55,372 ,000 2,633 ,353 1,927 3,340
assumed
Conclusie: kijk in de tabel Independent Samples Test en dan op de regel van ‘equal variances not
assumed’, daar vindt men t(58) = 7.468, p<.001. Dit houdt dus in dat er een verschil zit in
behandelmethoden bij ritueel gedrag. In de tabel Group Statistics wordt weergegeven dat exposure
op moc3 een gemiddelde heeft van 6.93 en responsepreventie 4.30. Dit houdt in dat personen in
responsepreventie gemiddeld lager scoren op moc3 en deze dus het rituele gedrag meer beïnvloedt.
, Opdracht 3
Beantwoord onderzoeksvraag 1 op grond van een repeated measures variantieanalyse van de
data. In de output staan twee varianten van deze analyse, namelijk de univariate en de
multivariate benadering. De ene versie heb je gehad bij Statistiek 2 deel A, en de andere bij
Statistiek 2 deel B. Bepaal van elke tabel in de output of hij behoort tot de univariate
benadering, de multivariate benadering, of beide. Bepaal welke benadering in dit geval het
beste kan worden gebruikt.
Tabel Methode
Within-Subject Factors Univariate + multivariatie methode
Between-Subjects Factors Geen van beide
Multivariate Tests Multivariate methode
Mauchly’s Test of Sphericity Univariate methode
Tests of Within-Subjects Effects Univariate methode
Tests of Within-Subjects Contrasts Univariate + multivariate methode
Tests of Between-Subject Effects Geen van beide
Estimated Marginal Means Univariate + multivariate methode
De output tabellen die je gebruikt verschillen per methoden:
- Univariate methoden: Tests of Within-Subjects Effects en Mauchly’s Test of Sphericity.
- Multivariate methoden: Multivariate Test en Test of Within-Subjects Contrasts.
Repeated measures anova
Analyze → General Linear Model → repeated measures →
- Stap 1: within-subject factor name: tijd & number of levels: 3 → add → define
- Stap 2: moc 1, moc 2 en moc 3 selecteren en verplaatsen naar within-subject variables &
between-subjects factor = cond
- Stap 3: contrast: within-subject factor tijd op simple (last) zetten
- Stap 4: options:
• display means for: cond, tijd en cond*tijd
• display: descriptive statistics en estimates of effect size → continue
- Stap 5: Plots: horizontal axis = tijd & separate lines = cond → add → continue
→ ok
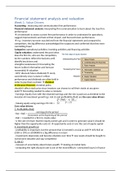
Bij deze analyse moet je multivariaat testen, dit kan je beslissen aan de hand van de volgende regel.
Multivariate test:
- Als K (aantal condities) ≤ 8 en N (aantal subjecten) ≥ (K+30) en Huynh-Feldt schatting voor
Epsilon < 0.85.
Bij deze analyse zijn er 2 condities EN N=60 dus groter dan 32 EN epsilon is 0.628. De epsilon is af te
lezen in de onderstaande tabel.
Mauchly's Test of Sphericitya
Measure: MEASURE_1
Epsilonb
Within Subjects Mauchly's Approx. Chi- Greenhouse- Huynh- Lower-
Effect W Square df Sig. Geisser Feldt bound
Tijd ,363 57,725 2 ,000 ,611 ,628 ,500
Tests the null hypothesis that the error covariance matrix of the orthonormalized transformed dependent
variables is proportional to an identity matrix.
a. Design: Intercept + cond
Within Subjects Design: Tijd
b. May be used to adjust the degrees of freedom for the averaged tests of significance. Corrected tests are
displayed in the Tests of Within-Subjects Effects table.
Onderzoeksvraag 1: Ritueel gedrag wordt meer beïnvloed door responspreventie alleen
dan door exposure in vivo alleen.
Opdracht 1
Onderzoeksvraag 1 gaat over ritueel gedrag.
Met welke vragenlijst is dit gemeten?
Gebruikte vragenlijst is Mauldsly Obsessive-Compulsive Inventory (MOC(I)).
Welke variabelen in het databestand bevatten dne scores hiervan?
Variabelen moc1, moc 2 en moc 3 in databestand bevatten de scores van deze vragenlijst.
Aangezien er drie variabelen zijn met scores van de vragenlijst, kun je je afvragen of dit nu
drie subschaalscores zijn van één meting of drie totaalscores van in tijd herhaalde metingen.
Zoek op (in deze tekst en elders) of deze vragenlijst subschalen heeft en in hoeverre het
gebruikelijk is om een totaalscore te gebruiken. Beredeneer vervolgens wat vermoedelijk de
inhoud van de variabelen in het bestand is.
Moc1, moc2 en moc 3 zijn respectievelijk voor-, na-, en vervolgmeting. Er zijn wel subschalen in de
test, maar dit zijn er vier. De scores in het bestand zijn elk totaalscores de vier subschalen per
tijdsmoment.
Beredeneer vervolgens wat vermoedelijk de inhoud van de variabelen in het bestand is.
Ppn = proefpersoon
Cond = conditie
VSA = obsessieve angst gemeten door Anxiety Discomfort Scale (tijdstippen), 5 angst situaties
MOC = ritueel gedrag gemeten door MOCI
Dep = depressiviteit via Hamilton Depression Scale
Ang = angst (algemene angst)
RI 1-28 = relationship inventory, oftewel kwaliteit therapeutische relatie.
De inhoud van deze variabelen zijn totaalscores.
Opdracht 2
Gebruik bij deze opdracht alleen de metingen 1 en 3, en daarnaast de variabele conditie.
Beantwoord onderzoeksvraag 1 met een t-toets. Dit kan op twee manieren. Doe ze allebei.
Schrijf over beide analyses een beknopt rapport.
Design:
AV: verschilscore (nameting – voormeting) OF moc3
OV: conditie (exposure = 1 en responsepreventie = 2)
Voor verschilscore:
Transform → Compute Variable → Target Variable: verschilscore → Numeric expression: moc3 –
moc 1 → OK
Analyze → Compare Means → Independent-Samples T Test → Test Variables: verschilscore →
Grouping Variable: condition → Define Groups: used specified values … group 1 = 1 (exposure) en
group 2 = 2 (responsepreventie) → continue → Ok.
Output:
Group Statistics
cond N Mean Std. Deviation Std. Error Mean
Verschilscore exposure 30 -1,93 1,911 ,349
responspreventie 30 -4,57 2,359 ,431
, Independent Samples Test
Levene's Test
for Equality of
Variances t-test for Equality of Means
95%
Confidence
Sig. Interval of the
(2- Mean Std. Error Difference
F Sig. t df tailed) Difference Difference Lower Upper
Verschilscore Equal
variances 2,918 ,093 4,751 58 ,000 2,633 ,554 1,524 3,743
assumed
Equal
variances not 4,751 55,602 ,000 2,633 ,554 1,523 3,744
assumed
Conclusie: kijk in de tabel Independent Samples Test en dan op de regel van ‘equal variances not
assumed’, daar vindt men t(58) = -4.751, p<.001. Dit houdt dus in dat er een verschil zit in
behandelmethoden bij ritueel gedrag. In de tabel Group Statistics wordt weergegeven dat exposure
een kleinere verschilscore dan responsepreventie, wat inhoudt dat responsepreventie het rituele
gedrag meer beïnvloed.
Voor moc3:
Analyze → Compare Means → Independent-Samples T Test → Test Variables: moc3 → Grouping
Variable: condition → Define Groups: used specified values … group 1 = 1 en group 2 =2 → continue
→ Ok
Output:
Group Statistics
cond N Mean Std. Deviation Std. Error Mean
compulsive behaviour 3 exposure 30 6,93 1,507 ,275
responspreventie 30 4,30 1,208 ,221
Independent Samples Test
Levene's Test
for Equality of
Variances t-test for Equality of Means
95%
Confidence
Sig. Interval of the
(2- Mean Std. Error Difference
F Sig. t df tailed) Difference Difference Lower Upper
compulsive Equal
behaviour 3 variances 1,049 ,310 7,468 58 ,000 2,633 ,353 1,928 3,339
assumed
Equal
variances not 7,468 55,372 ,000 2,633 ,353 1,927 3,340
assumed
Conclusie: kijk in de tabel Independent Samples Test en dan op de regel van ‘equal variances not
assumed’, daar vindt men t(58) = 7.468, p<.001. Dit houdt dus in dat er een verschil zit in
behandelmethoden bij ritueel gedrag. In de tabel Group Statistics wordt weergegeven dat exposure
op moc3 een gemiddelde heeft van 6.93 en responsepreventie 4.30. Dit houdt in dat personen in
responsepreventie gemiddeld lager scoren op moc3 en deze dus het rituele gedrag meer beïnvloedt.
, Opdracht 3
Beantwoord onderzoeksvraag 1 op grond van een repeated measures variantieanalyse van de
data. In de output staan twee varianten van deze analyse, namelijk de univariate en de
multivariate benadering. De ene versie heb je gehad bij Statistiek 2 deel A, en de andere bij
Statistiek 2 deel B. Bepaal van elke tabel in de output of hij behoort tot de univariate
benadering, de multivariate benadering, of beide. Bepaal welke benadering in dit geval het
beste kan worden gebruikt.
Tabel Methode
Within-Subject Factors Univariate + multivariatie methode
Between-Subjects Factors Geen van beide
Multivariate Tests Multivariate methode
Mauchly’s Test of Sphericity Univariate methode
Tests of Within-Subjects Effects Univariate methode
Tests of Within-Subjects Contrasts Univariate + multivariate methode
Tests of Between-Subject Effects Geen van beide
Estimated Marginal Means Univariate + multivariate methode
De output tabellen die je gebruikt verschillen per methoden:
- Univariate methoden: Tests of Within-Subjects Effects en Mauchly’s Test of Sphericity.
- Multivariate methoden: Multivariate Test en Test of Within-Subjects Contrasts.
Repeated measures anova
Analyze → General Linear Model → repeated measures →
- Stap 1: within-subject factor name: tijd & number of levels: 3 → add → define
- Stap 2: moc 1, moc 2 en moc 3 selecteren en verplaatsen naar within-subject variables &
between-subjects factor = cond
- Stap 3: contrast: within-subject factor tijd op simple (last) zetten
- Stap 4: options:
• display means for: cond, tijd en cond*tijd
• display: descriptive statistics en estimates of effect size → continue
- Stap 5: Plots: horizontal axis = tijd & separate lines = cond → add → continue
→ ok
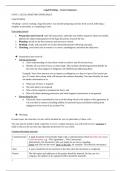
Bij deze analyse moet je multivariaat testen, dit kan je beslissen aan de hand van de volgende regel.
Multivariate test:
- Als K (aantal condities) ≤ 8 en N (aantal subjecten) ≥ (K+30) en Huynh-Feldt schatting voor
Epsilon < 0.85.
Bij deze analyse zijn er 2 condities EN N=60 dus groter dan 32 EN epsilon is 0.628. De epsilon is af te
lezen in de onderstaande tabel.
Mauchly's Test of Sphericitya
Measure: MEASURE_1
Epsilonb
Within Subjects Mauchly's Approx. Chi- Greenhouse- Huynh- Lower-
Effect W Square df Sig. Geisser Feldt bound
Tijd ,363 57,725 2 ,000 ,611 ,628 ,500
Tests the null hypothesis that the error covariance matrix of the orthonormalized transformed dependent
variables is proportional to an identity matrix.
a. Design: Intercept + cond
Within Subjects Design: Tijd
b. May be used to adjust the degrees of freedom for the averaged tests of significance. Corrected tests are
displayed in the Tests of Within-Subjects Effects table.