HC 1
Schatten: steekproef M → populatie μ (inferentie)
Toetsen: populatie → steekproef
Standaard afwijking (SD, s) = verschil observaties en populatiegemiddelde
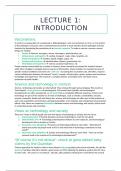
Standard error (SE) → standaardafwijking van de steekproevenverdeling in een opsomming
van veel samples tov van populatiegemiddelde.
- kan niet worden uitgerekend op basis van 1 steekproef
→ formule: (SE) / (wortel van grootte van steekproef, n)
Nominaal naam cat.
Ordinaal volgorde (laag, midden, hoog) cat.
Interval stappen zijn even groot (1, 2, 3 intervallen hebben betekenis) continue
Ratio 0 is betekenisvol continue
Puntschattingen:
- Gemiddelde
- Proportie is voor dichotome variabelen ()
- Mediaan (continue variabelen zoals inkomen met uitschieters)
- Modus (categorische / ordinale variablen)
Significantieniveau alfa
→ p < alfa = .005 , dan nulhypothese verwerpen
Power is het terecht verwerpen van de nulhypothese, afhankelijk van
- grootte van het effect
- ‘ruis’ in data (SD)
- grootte van N, proefpersonen
Z is standaard normaalverdeling, is uit te rekenen met de populatiestandaardafwijking
(sigma), maar meestal hebben we die niet, alleen steekproefstandaardafwijking
→ oplossing is t-verdeling (minder significant dan Z)
s gebruiken ipv sigma
- toets voor proportie (dicho) = toets voor gemiddelde (int/ratio) → one-sample t-test
Conclusie trekken op verwerping van nulhypothese
1. verwerpen H0 (p-waarde significant)
2. dit suggereert dat er een effect is in de populatie
3. Ha wordt dus ondersteund, maar niet geaccepteerd!
Type I fout: H0 verwerpen, maar deze is waar
Type II fout: H0 niet verwerpen, maar deze is
- afhankelijk van power
Betrouwbaarheidsinterval: in 95% van de gevallen ligt de daadwerkelijke waarde van de
populatie binnen de observaties van de steekproeven (indien herhaald). Te vinden door:
- CI95% = steekproefgemiddelde / proportie +- 1.96 x SE
, - Examine (menu SPSS syntax:) Examine reli/cint 95.
- t-toets
95 % = tweezijdig toetsen
90% = eenzijdig
HC 2
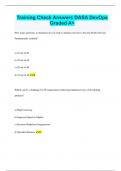
verband tussen nominale variabelen
j=1 j=2 marge rij
i=1 f1,1 f1,2 f1,+
i=2 f2,1 f2,2 f2,+
marge kolom f+,1 f+,2 f+,+
Conditionele frequentiedistributie: frequentieverdeling van één variabele, voor specifieke
waarde van de andere variabele (afhankelijk zijn van elkaar).
Gezamenlijke (joint) frequentiedistributie: frequentie van een combinatie van twee (of meer)
variabelen.
Frequentie / totaal = kansverdeling
- marginale kansverdeling marges / totaal
- conditionele kansverdeling conditionele frequenties / marge
- joint kansverdeling 1 celfrequentie / totaal
Toetsen met kruistabellen
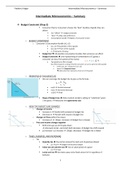
1. Verwachte celfrequenties (fe) berekenen als er GEEN verband is → hoe het eruit zou
zien onder de nulhypothese
- (marge*marge) / totaal = fe
2. Verschil berekenen voor en na berekening: verschil fo en fe
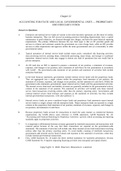
3. Teststatistiek berekenen (grote formule voor Chi-kwadraat waarde → p-waarde
aflezen uit standaardtabel)
4. Chi-kwadraat toets uitvoeren
Assumpties Chi-kwadraat toets
- Als de fe erg klein zijn, werkt Chi-kwadraat toets niet goed
- ‘Cochran’s rule’: alle frequenties moeten fe ≥ 1 zijn, en 80% van fe ≥ 5
Significante Chi-kwadraat toets:
- twee nominale variabelen hebben een verband
- probleem: je weet niet welke cellen het meest bijdragen aan de significante toets
- oplossing: per cel berekenen wat de gestandaardiseerde verschillen
(gestandaardiseerde residuen) tussen geobserveerde en verwachte
frequenties zijn.
- Z-score: -2 < pi < 2 = significant (bij een alpha = .05)
- Z-score: -3 < pi < 3 komt niet veel voor
Schatten: steekproef M → populatie μ (inferentie)
Toetsen: populatie → steekproef
Standaard afwijking (SD, s) = verschil observaties en populatiegemiddelde
Standard error (SE) → standaardafwijking van de steekproevenverdeling in een opsomming
van veel samples tov van populatiegemiddelde.
- kan niet worden uitgerekend op basis van 1 steekproef
→ formule: (SE) / (wortel van grootte van steekproef, n)
Nominaal naam cat.
Ordinaal volgorde (laag, midden, hoog) cat.
Interval stappen zijn even groot (1, 2, 3 intervallen hebben betekenis) continue
Ratio 0 is betekenisvol continue
Puntschattingen:
- Gemiddelde
- Proportie is voor dichotome variabelen ()
- Mediaan (continue variabelen zoals inkomen met uitschieters)
- Modus (categorische / ordinale variablen)
Significantieniveau alfa
→ p < alfa = .005 , dan nulhypothese verwerpen
Power is het terecht verwerpen van de nulhypothese, afhankelijk van
- grootte van het effect
- ‘ruis’ in data (SD)
- grootte van N, proefpersonen
Z is standaard normaalverdeling, is uit te rekenen met de populatiestandaardafwijking
(sigma), maar meestal hebben we die niet, alleen steekproefstandaardafwijking
→ oplossing is t-verdeling (minder significant dan Z)
s gebruiken ipv sigma
- toets voor proportie (dicho) = toets voor gemiddelde (int/ratio) → one-sample t-test
Conclusie trekken op verwerping van nulhypothese
1. verwerpen H0 (p-waarde significant)
2. dit suggereert dat er een effect is in de populatie
3. Ha wordt dus ondersteund, maar niet geaccepteerd!
Type I fout: H0 verwerpen, maar deze is waar
Type II fout: H0 niet verwerpen, maar deze is
- afhankelijk van power
Betrouwbaarheidsinterval: in 95% van de gevallen ligt de daadwerkelijke waarde van de
populatie binnen de observaties van de steekproeven (indien herhaald). Te vinden door:
- CI95% = steekproefgemiddelde / proportie +- 1.96 x SE
, - Examine (menu SPSS syntax:) Examine reli/cint 95.
- t-toets
95 % = tweezijdig toetsen
90% = eenzijdig
HC 2
verband tussen nominale variabelen
j=1 j=2 marge rij
i=1 f1,1 f1,2 f1,+
i=2 f2,1 f2,2 f2,+
marge kolom f+,1 f+,2 f+,+
Conditionele frequentiedistributie: frequentieverdeling van één variabele, voor specifieke
waarde van de andere variabele (afhankelijk zijn van elkaar).
Gezamenlijke (joint) frequentiedistributie: frequentie van een combinatie van twee (of meer)
variabelen.
Frequentie / totaal = kansverdeling
- marginale kansverdeling marges / totaal
- conditionele kansverdeling conditionele frequenties / marge
- joint kansverdeling 1 celfrequentie / totaal
Toetsen met kruistabellen
1. Verwachte celfrequenties (fe) berekenen als er GEEN verband is → hoe het eruit zou
zien onder de nulhypothese
- (marge*marge) / totaal = fe
2. Verschil berekenen voor en na berekening: verschil fo en fe
3. Teststatistiek berekenen (grote formule voor Chi-kwadraat waarde → p-waarde
aflezen uit standaardtabel)
4. Chi-kwadraat toets uitvoeren
Assumpties Chi-kwadraat toets
- Als de fe erg klein zijn, werkt Chi-kwadraat toets niet goed
- ‘Cochran’s rule’: alle frequenties moeten fe ≥ 1 zijn, en 80% van fe ≥ 5
Significante Chi-kwadraat toets:
- twee nominale variabelen hebben een verband
- probleem: je weet niet welke cellen het meest bijdragen aan de significante toets
- oplossing: per cel berekenen wat de gestandaardiseerde verschillen
(gestandaardiseerde residuen) tussen geobserveerde en verwachte
frequenties zijn.
- Z-score: -2 < pi < 2 = significant (bij een alpha = .05)
- Z-score: -3 < pi < 3 komt niet veel voor