Advanced Research Methods
Intro statistical modelling
Statistical modelling: specifying a model that fits your data to better describe or understand
reality.
When?
- Substantial number of comparable cases
- Random sample from larger population
- Valid and reliable measurements
We use statistical modelling to concise representation of a large amount of information. So
that they become meaningful to us.
� Generalization to larger population (statistical inference)
� Use sampling theory to evaluate generality (Central Limit Theorem) 🡪 how likely is it,
on the basis of what we found in our sample, that the population effect is 0.
Another reason for statistical modelling is that it allows us to conduct stringent tests of causal
hypotheses
- By applying regression models to observational data, we are not able to strictly
isolate the effect on X on Y as we do in an expertiment.
- We can aprocement this experimental logic by estimating the average effect of X on
Y while controlling for possible confounding factors.
- Causation is assumed to be probabilistic (not perfectly predicting each case)
-
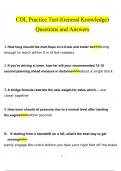
Yi: observed values of Y
Y dakje: average value of Y
Ei: individual amount of deviation of that value
The goal of simple linear regression is to better explain the variation in Y by adding X
variables to the equation. This is about observed Y.
For example: Y is the amount of hours people spend on studying. Adding the X value (how
interested they are in studying) might help us to better explain Y. Hypothesis: the more
interested you are, the more hours you will spend on your study. This is about observed Y.
In multiple regression you can at more X variables to better explain Y. B Xi represents the
effect of X1 while keeping other X variables constant. This is what makes of estimating
effects while controlling for other variables. This is about predicted of Y
Coefficient b is an estimate of ‘true effect; β in the population. The uncertainty due to
sampling variability is expressed in the standard errors of the coefficients.
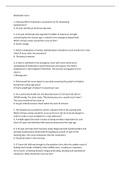
,Black dots are individual observations
Blue line: is estimated trough the least squares method. The line that optimally minimalizes
the distance to all of these dots
This only works well if certain assumptions about ε are true.
1. Linearity and additivity
2. Error term is normally distributed
3. Homoscedasticity
4. Independent errors
- Important in analysis of nested data.
-
And if β
should reflect causal effect: exogeneity
Lecture 1 07/11/2022
Theory & Inference
Our goal as social scientists is to develop and test theories. What is a theory? It is a logically
interrelated propositions about empirical reality or a systematic explanation for the observed
facts and laws that relate to a specific aspect of life.
We are trying to say something more general about empirical reality.
Inference: to goal of social science is to infer beyond the immediate data to something
broader that is not directly observed. E.g.:
● From sample to population (quantitative studies)
● From case to broader set of cases (qualitative studies)
You can also make an distinction between inductive and deductive inference:
● Theory generating
● Theory testing
But we need both
,We miss something when we focus on the logic of verification. We need to go into the world,
see what is actually happening, and form theories from here (the deductive part). We need
both (Glaser)
Distinction between descriptive and causal inference
● Focus on explanation (X->Y) (causal inference)
● However, description necessary first step (descriptive). We should establish what
something means in reality, how does it manifest itself
▪ Goldthorpe: show what is happening before attempting to explain why
it is happening
▪
Do voters and non voters differ in their satisfaction with democracy?
: this is causal
Through which mechanism does casting a vote influence satisfaction with
democracy?
: this is causal focusses on the causal process. It assumes there is a causal effect and it
focussed on how this effect works.
Descriptive questions:
o How high is election turnout in different states of the US?
o How did election turnout in in the US develop over the past three decades
o How is the war in Ukraine framed by right-wing media?
Causal inference questions:
o How do economic conditions impact cross-state differences in turnout?
o What is the effect of social media use on the decision to vote?
o Through which mechanisms does social media use influence people’s voting
decision (focus on the arrow, not x or y)?
Causation as robust dependence
Goldthorpe outlines three approaches to causality. It does so by looking at a research
method used.
1. Robust dependence. (typically regression-based models)
a. While correlation does not imply causation, causation must in some way or
other imply association.
Correlation: two variables are associated in a way.
i. If X goes up Y goes up, observed together and assess whether they
move together.
ii. In order to know whether X causes Y, we should first test whether they
correlate. It should be robust: the correlation remains after controlling
for possible other explanations (confounders). What you are left with,
after controlling, is the causal effect.
iii. Spurious association and omitted variable bias (discussed in week 5)
:If the correlation does not hold up when controlling for Z, the
correlation between X and Y is a spurious association.
, The variable education could affect both income and trust. If the higher educated people also
have an higher income and higher political trust, education creates a correlation between
these variables. It creates a causal relationship between income and trust. It may also just
mean that people with higher education have higher values on both of these variables.
You call this spurious association and Omitted variable bias
If the association or correlation between income and trust is not based on a true causal
effect. It could be a spurious association so the effect is spurious it is caused by a omitted
variable.
Critiques on this approach:
1. Feels unsatisfactory. You can never be sure that you controlled for all the possible
confounders. When are you done controlling?
a. Alternative: consequential manipulation (experimental logic)
Based on counter factional reasoning: observes Y in the presence and
absence of X. In comparing these two situations, you can see what the actual
effect of X on Y is.
Problem, can you have an exact replica of the first situation? This is not
possible.
Experimental research solved this by random assignment. Because of this
random assignment, you get to the idea of average differences and can
assume both versions are equal and comparable. counterfactual reasoning,
observe Y in the presence and absence of X (more on this in week 5)
Another problem: outside the control of the researches
▪ Effect of the causes: causes must be manipulable
▪ The problem of agency: people have a free will
Experiments are looking at the effects of causes, whereas robust dependency
looks at the causes of effects.
So why are we all not doing experiments? Because of course you can only do
experiments if the cause itself is manipulable. I can give myself a coffee or
not. Effects of causes: causes must be manipulable. the second is the
problem of agency. We are studying human beings. They act because they
want to act in a certain way. Maybe they feel more motivated some days. A
researcher can not manipulate this.
2. What’s actually the mechanism?
Mechanisms are a theoretical account that specifies how specific outcomes or
empirical regularities come about. It show she structure of the causal process. And it
shows the logical connection between X an Y.
Robust dependence is about correlation. Goldthorpe misses a story of how X and Y
are connected. What is the process from X Y. Oke we might observe that X has an
Intro statistical modelling
Statistical modelling: specifying a model that fits your data to better describe or understand
reality.
When?
- Substantial number of comparable cases
- Random sample from larger population
- Valid and reliable measurements
We use statistical modelling to concise representation of a large amount of information. So
that they become meaningful to us.
� Generalization to larger population (statistical inference)
� Use sampling theory to evaluate generality (Central Limit Theorem) 🡪 how likely is it,
on the basis of what we found in our sample, that the population effect is 0.
Another reason for statistical modelling is that it allows us to conduct stringent tests of causal
hypotheses
- By applying regression models to observational data, we are not able to strictly
isolate the effect on X on Y as we do in an expertiment.
- We can aprocement this experimental logic by estimating the average effect of X on
Y while controlling for possible confounding factors.
- Causation is assumed to be probabilistic (not perfectly predicting each case)
-
Yi: observed values of Y
Y dakje: average value of Y
Ei: individual amount of deviation of that value
The goal of simple linear regression is to better explain the variation in Y by adding X
variables to the equation. This is about observed Y.
For example: Y is the amount of hours people spend on studying. Adding the X value (how
interested they are in studying) might help us to better explain Y. Hypothesis: the more
interested you are, the more hours you will spend on your study. This is about observed Y.
In multiple regression you can at more X variables to better explain Y. B Xi represents the
effect of X1 while keeping other X variables constant. This is what makes of estimating
effects while controlling for other variables. This is about predicted of Y
Coefficient b is an estimate of ‘true effect; β in the population. The uncertainty due to
sampling variability is expressed in the standard errors of the coefficients.
,Black dots are individual observations
Blue line: is estimated trough the least squares method. The line that optimally minimalizes
the distance to all of these dots
This only works well if certain assumptions about ε are true.
1. Linearity and additivity
2. Error term is normally distributed
3. Homoscedasticity
4. Independent errors
- Important in analysis of nested data.
-
And if β
should reflect causal effect: exogeneity
Lecture 1 07/11/2022
Theory & Inference
Our goal as social scientists is to develop and test theories. What is a theory? It is a logically
interrelated propositions about empirical reality or a systematic explanation for the observed
facts and laws that relate to a specific aspect of life.
We are trying to say something more general about empirical reality.
Inference: to goal of social science is to infer beyond the immediate data to something
broader that is not directly observed. E.g.:
● From sample to population (quantitative studies)
● From case to broader set of cases (qualitative studies)
You can also make an distinction between inductive and deductive inference:
● Theory generating
● Theory testing
But we need both
,We miss something when we focus on the logic of verification. We need to go into the world,
see what is actually happening, and form theories from here (the deductive part). We need
both (Glaser)
Distinction between descriptive and causal inference
● Focus on explanation (X->Y) (causal inference)
● However, description necessary first step (descriptive). We should establish what
something means in reality, how does it manifest itself
▪ Goldthorpe: show what is happening before attempting to explain why
it is happening
▪
Do voters and non voters differ in their satisfaction with democracy?
: this is causal
Through which mechanism does casting a vote influence satisfaction with
democracy?
: this is causal focusses on the causal process. It assumes there is a causal effect and it
focussed on how this effect works.
Descriptive questions:
o How high is election turnout in different states of the US?
o How did election turnout in in the US develop over the past three decades
o How is the war in Ukraine framed by right-wing media?
Causal inference questions:
o How do economic conditions impact cross-state differences in turnout?
o What is the effect of social media use on the decision to vote?
o Through which mechanisms does social media use influence people’s voting
decision (focus on the arrow, not x or y)?
Causation as robust dependence
Goldthorpe outlines three approaches to causality. It does so by looking at a research
method used.
1. Robust dependence. (typically regression-based models)
a. While correlation does not imply causation, causation must in some way or
other imply association.
Correlation: two variables are associated in a way.
i. If X goes up Y goes up, observed together and assess whether they
move together.
ii. In order to know whether X causes Y, we should first test whether they
correlate. It should be robust: the correlation remains after controlling
for possible other explanations (confounders). What you are left with,
after controlling, is the causal effect.
iii. Spurious association and omitted variable bias (discussed in week 5)
:If the correlation does not hold up when controlling for Z, the
correlation between X and Y is a spurious association.
, The variable education could affect both income and trust. If the higher educated people also
have an higher income and higher political trust, education creates a correlation between
these variables. It creates a causal relationship between income and trust. It may also just
mean that people with higher education have higher values on both of these variables.
You call this spurious association and Omitted variable bias
If the association or correlation between income and trust is not based on a true causal
effect. It could be a spurious association so the effect is spurious it is caused by a omitted
variable.
Critiques on this approach:
1. Feels unsatisfactory. You can never be sure that you controlled for all the possible
confounders. When are you done controlling?
a. Alternative: consequential manipulation (experimental logic)
Based on counter factional reasoning: observes Y in the presence and
absence of X. In comparing these two situations, you can see what the actual
effect of X on Y is.
Problem, can you have an exact replica of the first situation? This is not
possible.
Experimental research solved this by random assignment. Because of this
random assignment, you get to the idea of average differences and can
assume both versions are equal and comparable. counterfactual reasoning,
observe Y in the presence and absence of X (more on this in week 5)
Another problem: outside the control of the researches
▪ Effect of the causes: causes must be manipulable
▪ The problem of agency: people have a free will
Experiments are looking at the effects of causes, whereas robust dependency
looks at the causes of effects.
So why are we all not doing experiments? Because of course you can only do
experiments if the cause itself is manipulable. I can give myself a coffee or
not. Effects of causes: causes must be manipulable. the second is the
problem of agency. We are studying human beings. They act because they
want to act in a certain way. Maybe they feel more motivated some days. A
researcher can not manipulate this.
2. What’s actually the mechanism?
Mechanisms are a theoretical account that specifies how specific outcomes or
empirical regularities come about. It show she structure of the causal process. And it
shows the logical connection between X an Y.
Robust dependence is about correlation. Goldthorpe misses a story of how X and Y
are connected. What is the process from X Y. Oke we might observe that X has an