You can message/email me to get the summary for 4 euros.
The summary includes all info from the slides/transparencies up until session 8 so far. notes from Pieters, and the thumbs up. Everything will be updated this week.
- “neutral” is an unacceptable word in attitudinal or behavioral surveys! It doesn’t clarify
whether the respondent didn’t know what to answer or didn’t care about the whole
question. It is also a safe option. “don’t know” is also not a good answer in these kind of
questions. How can you ‘not know’ if you’re satisfied? However, when asking knowledge
based questions, “don’t know” is a good answer “What is the capital of Spain?”
- The size of a sample does not say anything about the validity or reliability of a survey
- When there are 50 people in the population, is 42 respondents too much? It is a good
representation, however, you do not need so many! The formula to calculate the right
number will be explained in the second session.
Session 1 – Survey Validity Model
Survey
A systematic method to gather information about the properties of a sample of entities in order to
make quantitative inferences about the properties of the population to which the entities belong,
predominantly by asking questions to the entities.
– to survey = super videre = to look over
– Survey versus Census
– Self-report data versus other data
Survey methodology
Goal: Maximizing the validity of the inferences from surveys by minimizing the sources of error in
survey research.
Three functions of survey research:
1. Knowledge To predict and understand human behavior, its determinants and
consequences, and test theories about this for academic or professional purposes.
2. Influence Decision makers on need, urgency, success via report or media, and public on
topic via media.
3. Entertainment
Media Public
Survey
A History of Survey Research (pre 1930)
Layer 1: pre-scientific
Social problems
Mix of non-standardized questions and other data, such as observations
No systematic sampling or “census”
Face-to-face data collection
1
Eline van de Ven – Survey Research 2018-2019
,Response = finding
Charles Booth “Life and Labour of the People of London” (1889-1903)
Layer 2: scientific
Systematic view of man in the street or customer
Standardized questions
Systematic sampling
Multiple methods
Dr. Gallup 1st Market research director of Ad Agency (Y&R), 1930-1935. Gallup Organization
History in the Netherlands:
January 1899 by “Royal Decision” the Central Bureau of Statistics (CBS) was established. Director C.A.
Verrijn Stuart. In 1903-1904 the CBS had 40 employees. It focused, among others, on demographic,
social, economic, crime, judicial statistics.
NIPO, Nederlands Instituut voor Publieks Onderzoek
Established 1945, by Jan Stapel and Wim de Jonge
Jan Stapel († 2003):
Co-founder of ESOMAR (1948), Gallup International
Developer of the “Stapel” scale
2
Eline van de Ven – Survey Research 2018-2019
,Layer 3: multidisciplinary science
Social and cognitive psychology
o Participation in surveys, psychology of survey response
Computer science
o Electronic data collection, web and database design, programming
Statistics
o Sampling, probability, scale development
Future:
– Business
Increasing importance of personnel satisfaction, creativity and loyalty, implementation of
management and accounting practices.
Increasing importance of customer insight for marketing strategy development and evaluation
o SERVQUAL, Satisfaction research, brand equity, customer relationship, ICS,
cross-cultural preferences, attitudes
Reversing marketing channels
– Public policy
Accountability of public policy
Three goals of survey methodology:
1. Measurement: Responses measure the properties
2. Representation: Respondents represents the population
3. Analysis: Results identify the properties and their relationships in the population
3
Eline van de Ven – Survey Research 2018-2019
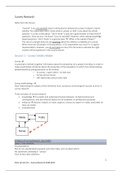
,The left part of this model is the measurement / questionnaire part
The right part of this model is the representation / sample part
The analysis is shown by the observed survey measures.
Measurement
Properties Characteristics and relationships in the population
- P: Reading habits and age
Conceptual model Constructs (latent variable) and their relationships
- CM: book versus magazine versus internet reading activity, at home and at work, and on-
route differs by age
Instrument Form in which overt variable is assessed
- M: “Have you read a book in the past six months?”
Response Response provided
- R: Yes or no
Edited Response
- ER: “perhaps” is not valid”
2. Representation
Population Set of units under study
- P: All adult Fins
Sampling frame Set of eligible units to survey
- SF: Finnish phone nr directory
Sample Set of units to survey
- S: 1000 Fins with phone nr.
Respondents Set of successfully surveyed units
- R: 120 Fins interviewed
Adjusted respondents Final set of respondents for analysis
- AR: 118 Fins remaining in sample
4
Eline van de Ven – Survey Research 2018-2019
,Total survey validity
The goal of the model
Maximizing the validity of reported survey findings by minimizing sources of error in survey
methodology.
I) Conceptualization error: when constructs do not map on the properties
i. Research question: e.g. do consumers during an economic crisis spend more on small indulgences
and if so, why?
ii. Model and prediction: e.g. yes, stress due to the economic crisis activates desires for small
rewards. Or: yes, uncertainty about future income activates tendency to postpone large
purchases, which is compensated by spending more on small indulgences.
5
Eline van de Ven – Survey Research 2018-2019
, II) Operationalization error: systematic departure from the constructs
i. Construct = e.g. emotional intelligence (EI) of consumers
ii. Measure = invalid measure of e.i, e.g. bad scale
Financial literacy
Construct: “A combination of awareness, knowledge, skill, attitude and behavior necessary to
make sound financial decisions and ultimately achieve individual financial wellbeing.” (OECD
INFE)
Brief measure:
Three items
Used world-wide
Importance:
Increasing responsibility for financial situation shifted to consumers (savings,
pensions, mortgages)
III) Coverage error: sampling frame does not capture the population
6
Eline van de Ven – Survey Research 2018-2019
The benefits of buying summaries with Stuvia:
Guaranteed quality through customer reviews
Stuvia customers have reviewed more than 700,000 summaries. This how you know that you are buying the best documents.
Quick and easy check-out
You can quickly pay through credit card or Stuvia-credit for the summaries. There is no membership needed.
Focus on what matters
Your fellow students write the study notes themselves, which is why the documents are always reliable and up-to-date. This ensures you quickly get to the core!
Frequently asked questions
What do I get when I buy this document?
You get a PDF, available immediately after your purchase. The purchased document is accessible anytime, anywhere and indefinitely through your profile.
Satisfaction guarantee: how does it work?
Our satisfaction guarantee ensures that you always find a study document that suits you well. You fill out a form, and our customer service team takes care of the rest.
Who am I buying these notes from?
Stuvia is a marketplace, so you are not buying this document from us, but from seller Elinevandeven. Stuvia facilitates payment to the seller.
Will I be stuck with a subscription?
No, you only buy these notes for $11.26. You're not tied to anything after your purchase.