100% satisfaction guarantee Immediately available after payment Both online and in PDF No strings attached
logo-home
Comprehensive Notes on Statistics 3, Social and Organizational Psychology Track $5.89
Add to cart

Class notes

Comprehensive Notes on Statistics 3, Social and Organizational Psychology Track

 2 purchases
  • Course
  • Institution

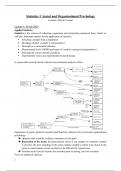
Comprehensive lecture notes from the course Statistics 3, Social and Organizational Psychology track written in English. Examples and images are used to make the text/terms clearer.

Preview 3 out of 19  pages

  • March 26, 2024
  • 19
  • 2023/2024
  • Class notes
  • Melvin vooren
  • All classes
avatar-seller
Statistics 3, Social and Organizational Psychology
Lecturer: Melvin Vooren

Lecture 1: 05 feb 2024
Applied Statistics
Statistics is the science of collecting, organizing and interpreting numerical facts, which we
call data. Important matters for the application of statistics:
 Selecting a sample from a population
 Deciding whether a sample is representative
 Descriptive or inferential statistics
 Measurement levels (NOIR) and types of variables (categorical/quantitative)
 Selecting the correct statistical analysis
 Experimental versus non-experimental research design

A system that can help decide what the best statistical analysis will be:


Importance of good empirical research (and therefore statistics) for social and organizational
psychology
 Opinions and scientific evidence sometimes lie far apart
 Regression to the mean, the phenomenon where if one sample of a random variable
is extreme, the next sampling of the same random variable is likely to be closer to the
mean, so rare/extreme events are likely to be followed by typical ones
 Extreme scores tend to become less extreme upon re-testing, can fool scientists
Focus on empirical analyses:

1

,  Comparison of two groups on one quantitative outcome variable (t-test)
 Comparison of two or more groups on one quantitative outcome variable (ANOVA)
 Determine relation between two quantitative variables (regression analysis)

Descriptive statistics summarize the sample or population data with numbers, tables and
graphs whereas inferential statistics make predictions about population parameters, based on
a (random) sample of data.

Descriptive statistics summarize the characteristics of a data set. Inferential statistics allow
you to test a hypothesis or assess whether your data is generalizable to the broader population.

Doing research by means of data, observation of characteristics
 Population is the total set of participants, relevant for the research question, focuses on
the entire subject (for example all students)
 Sample is a subset of the population about who the date is collected, this could be
random or selected

Reliability describes how reproducible/replicable a study is and if a study
can be repeated with the same results under the same conditions
(precision).

Validity refers to the accuracy of a measure, whether the results really do
represent what they are supposed to measure (bias).

In descriptive statistics, three dimensions are of importance:
 Central tendency, this measures the mean, mode and median and is a typical
observation
 Dispersion focuses on variability in observations and measures the standard deviation
(measure for the spread of a variable around the average), variance and interquartile
range
 Position focuses on the relative position of the observation and gives information
about relative positions of observations like a percentile

Variables measure characteristics that can differ between subjects, it represents an unknown
number or quantity, types could be behavioral-, stimulus-, subject- or physiological variables,
different measurement scales (NOIR)
 Nominal or unordered categories like eye color or biological sex
(categorial/qualitative)
 Ordinal or ordered categories like disagree, neutral or agree (categorial/qualitative)
 Interval or equal distance between consecutive values like degree Celsius
(quantitative/ numerical)
 Ratio or equal distance and true zero point (quantitative/numerical)


2

, The goal of inferential statistics is to make reliable and valid statements about the population
based on a sample, the sample statistic should not differ from the population parameter.
Solution for the stated problems could be a random (or other probability) sampling approach
of sufficient size that generates data for everyone approached with correct responses on all
items for all subjects.


Sample problems with inferential statistics, concerning reliability (error) and validity (bias):
 Sampling error, a natural (random) sampling variation, when the selected sample
does not represent the entire population, deviation in sampled versus true population
value
 Sampling bias, selective sampling, when a research study does not use a
representative sample of a target population, a consistent error (systematic errors)
 Response bias, incorrect answers, general term for situations where people do not
answer truthfully for whatever reason (systematic errors)
 Non-response bias, selective participation, when participants are unwilling or unable
to respond to a survey, those who opt out of a survey are systematically different than
those who complete it (systematic errors)

A sampling distribution is a probability distribution of a
statistic that is obtained through repeated sampling of a
specific population, it is the probability distribution for
the sample statistic (proportion, mean, regression
coefficient).

Population distribution is the distribution of the
population, sampling data distribution is the distribution of the sample or the distribution of an
estimator from a sample.

The central limit thereom says that the sampling distribution of the mean will always be
normally distributes as long as the sample size is large enough
 Empirical rule for normal distributions: 68% of the data falls within one standard
deviation, 95% within two standard deviations and 99.7% within three standard
deviations


3

The benefits of buying summaries with Stuvia:

Guaranteed quality through customer reviews

Guaranteed quality through customer reviews

Stuvia customers have reviewed more than 700,000 summaries. This how you know that you are buying the best documents.

Quick and easy check-out

Quick and easy check-out

You can quickly pay through credit card or Stuvia-credit for the summaries. There is no membership needed.

Focus on what matters

Focus on what matters

Your fellow students write the study notes themselves, which is why the documents are always reliable and up-to-date. This ensures you quickly get to the core!

Frequently asked questions

What do I get when I buy this document?

You get a PDF, available immediately after your purchase. The purchased document is accessible anytime, anywhere and indefinitely through your profile.

Satisfaction guarantee: how does it work?

Our satisfaction guarantee ensures that you always find a study document that suits you well. You fill out a form, and our customer service team takes care of the rest.

Who am I buying these notes from?

Stuvia is a marketplace, so you are not buying this document from us, but from seller IBS2000. Stuvia facilitates payment to the seller.

Will I be stuck with a subscription?

No, you only buy these notes for $5.89. You're not tied to anything after your purchase.

Can Stuvia be trusted?

4.6 stars on Google & Trustpilot (+1000 reviews)

62774 documents were sold in the last 30 days

Founded in 2010, the go-to place to buy study notes for 15 years now

Start selling
$5.89  2x  sold
  • (0)
Add to cart
Added