2024 BTM 200 Assignment 2 Concordia University
Question:
A number of tools are available to measure your system’s performance. Explore the following tools and use
them to gather data on your current system’s performance. (you must choose at least 2)
• Windows tools:
Use the Windows to collect data on CPU utilization and memory usage over a typical school day.
• Benchmarking suites:
Examine a sample of consumer benchmarking programs like PassMark’s PerformanceTest, Primate Lab’s
Geekbench, and Maxon’s Cinebench. Which subsystems do each of these products evaluate?
Based on the resource provided above, create a document in word and answer the following questions:
1. Which tool or tools you have used?
2. What were the results of the tests?
Submit a document containing the answers to the above question to the milestone.
I have a mac book air, so I have used activity monitor, which monitors the pc’s activities such as memory used,
active processors, etc. as I was asked in the question, I analyzed CPU use and memory use components over a
typical school day.
, • CPU activity monitor:
CPU, central processor unit, manage, proceed, and control all instructions that a person gives to the device
that’s why the CPU is known as the heart or the brain of the computer. In CPU activity monitor, there are so
many metrics that can be monitored such as CPU time, Threads, Idle wake ups, PID, and Users. CPU time is
the accumulated time that CPU used for operation of tasks. The thread is the subset of process. PID, process
identifier, is the specific number that identify each processor while it runs.
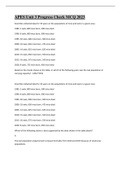
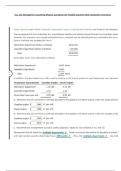
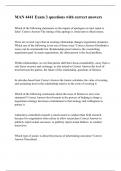
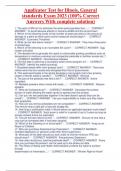
In the table below, it is shown the user percentage which is the total % of CPU used, 4.93%. In order to see
the utilization of each app from CPU, we need to see the % CPU. For instance, in the screen shut below,
“kernel_task” is taking the most CPU, 22.6%. by comparing the CPU percentages, I find out that the temporary
spikes are because of the app that is being used, and the usage of CPU will decrease when the app is not
being used. the Idle% is (100% minus both system% and user%), in this case the Idle is ( 100%-8.37%-4.93%=
86.70%)
Question:
A number of tools are available to measure your system’s performance. Explore the following tools and use
them to gather data on your current system’s performance. (you must choose at least 2)
• Windows tools:
Use the Windows to collect data on CPU utilization and memory usage over a typical school day.
• Benchmarking suites:
Examine a sample of consumer benchmarking programs like PassMark’s PerformanceTest, Primate Lab’s
Geekbench, and Maxon’s Cinebench. Which subsystems do each of these products evaluate?
Based on the resource provided above, create a document in word and answer the following questions:
1. Which tool or tools you have used?
2. What were the results of the tests?
Submit a document containing the answers to the above question to the milestone.
I have a mac book air, so I have used activity monitor, which monitors the pc’s activities such as memory used,
active processors, etc. as I was asked in the question, I analyzed CPU use and memory use components over a
typical school day.
, • CPU activity monitor:
CPU, central processor unit, manage, proceed, and control all instructions that a person gives to the device
that’s why the CPU is known as the heart or the brain of the computer. In CPU activity monitor, there are so
many metrics that can be monitored such as CPU time, Threads, Idle wake ups, PID, and Users. CPU time is
the accumulated time that CPU used for operation of tasks. The thread is the subset of process. PID, process
identifier, is the specific number that identify each processor while it runs.
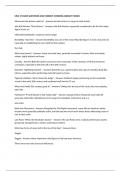
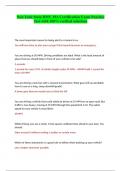
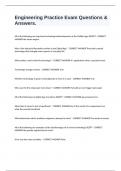
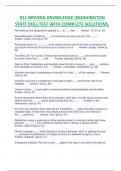
In the table below, it is shown the user percentage which is the total % of CPU used, 4.93%. In order to see
the utilization of each app from CPU, we need to see the % CPU. For instance, in the screen shut below,
“kernel_task” is taking the most CPU, 22.6%. by comparing the CPU percentages, I find out that the temporary
spikes are because of the app that is being used, and the usage of CPU will decrease when the app is not
being used. the Idle% is (100% minus both system% and user%), in this case the Idle is ( 100%-8.37%-4.93%=
86.70%)