Unit 13 – Visualizing and analyzing bivariate rela6onships in R
13.1. Con(ngency table
How we can display a rela1onship between two variables using tables and graphs
® Useful to help discover if two variables are correlated or not.
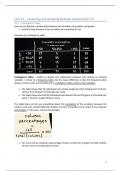
Example of a con-ngency table
Con$ngency table > enable to display the rela1onship between two ordinal or nominal
variables > similar to a frequency table, but the major difference is that the frequency table
always concerns only one variable and a con1ngency table concerns two variables.
® The table shows that 33 individuals have a body weight less then 50 kg and 27 of them,
eat less then 50 gram of chocolate per week.
® The table shows also that 90 individuals eat between 50 and 150 gram of chocolate per
week. 7 of them, weight 90 kg or more.
The table does not tell you something about the correla1on of the variables, because the
columns and rows contain different numbers of cases. It provides more insides if you compute
percentages. In this case, column percentages.
® For every cell we compute a percentage of cases in that cell, compare to total number
of cases in the correspondent column.
1
,Example
® In the cell with ‘24’ > we have 24 cases. The total number of cases in this column is 60.
Percentage: 24/60 x 100 = 40%
Condi&onal propor&ons
You can also express the percentages as propor1ons.
® 40% > 0,4
This propor1ons also called, condi1onal propor1ons > because the forma1on is condi1onal on
another variable.
Marginal propor&ons
We can also ignore the informa1on we have about ‘chocolate consump1on’ and use the count
in the margins of the table > marginal propor1ons.
® For those who eats more then 150 gram of chocolate per week, 56% weights 90 kg or
more.
® These percentages shows that those who eat more chocolate, are also more likely to
weight more. And those who eats less chocolate, are also more likely to weigh less.
o Other words > the percentages show that there is a correla1on between
chocolate consump1on and body weight.
2
,Con$ngency table is useful for nominal and ordinal variables
® Not for quan1ta1ve variable > then is a sca/erplot very useful
To make a scaZerplot > you have to draw two lines
® Horizontal > X-as (independent variable)
® Ver1cal > Y-as (dependent variable)
If there is no dis1nc1on between the dependent and independent variable, the placement on
the Y-as and X-as is a maZer of choice.
® ScaZerplot shows that there is a rela1onship between chocolate consump1on and
body weight > the more chocolate you eat, the higher your body weight.
Key terms
Key terms unit 13 Definition
Bivariate analysis The analysis of two variables to determine relationships between
them
Contingency table Contingency table > enable to display the relationship between
two ordinal or nominal variables > similar to a frequency table, but
the major difference is that the frequency table always concerns
only one variable and a contingency table concerns two variables.
Scatterplot Uses dots to represent values for two different numeric variables.
For quantitative variable > then is a scatterplot very useful
Regression line An estimate (schatting) of the line that describes the true, but
unknown, linear relationship between the two variables
Strength (of a bivariate relationship) The bivariate analysis allows you to investigate the relationship
between two variables. It is useful to determine whether there is a
correlation between the variables and, if so, how strong the
connection is.
3
, Direction (of a bivariate relationship) The direction is either positive, negative, or neither. The strength
can be described as weak, moderate, or strong.
Linear relationship A straight-line relationship between two variables
Unit 24 – Describing the associa6on between two variables
24.1. Pearson’s r
ScaZerplot > rela1onship between two variables
® Independent variable > X-as
® Dependent variable > Y-as
Pearson’s R > how strong is the rela1on between the independent and the dependent
variable?
• It expresses the direc1on and strength of the linear correla1on between two
variables with one single number.
1. Strong posi$ve linear rela$onship > the line goes up, when variable X goes up,
variable Y goes also up.
2. Strong nega$ve linear rela$onship > the line goes down, when variable X goes up,
variable Y goes down.
3. Weak posi$ve linear rela$onship > the individual cases are much further removed
from the line.
4. Perfect nega$ve linear rela$onship > all cases lie exactly on the line
5. Curvilinear rela$onship > the line that best represent the rela1onship between the
two variables is not straight, instead it is a U-shape line.
4

