Week 8 Knowledge Check Homework Practice Questions
1
2
Your work has been saved and submitted
Written Jan 24, 2024 7:30 PM - Jan 24, 2024 8:14 PM • Attempt 1 of 4
Attempt Score 19. - 98.34 %
Overall Grade (Highest Attempt) 19. - 98.34 %
Question 1 point
A college prep school advertises that their students are more prepared to succeed in college than other
schools. To verify this, they categorize GPA's into 4 groups and look up the proportion of students at a
state college in each category. They find that 7% have a 0-0.99, 21% have a 1-1.99, 37% have a 2-2.99,
and 35% have a 3-4.00 in GPA.
They then take a random sample of 200 of their graduates at the state college and find that 19 has a 0-
0.99, 28 have a 1-1.99, 82 have a 2-2.99, and 71 have a 3-4.00.
Can they conclude that the grades of their graduates are distributed differently than the general population
at the school? Test at the 0.05 level of significance.
Enter the test statistic - round to 4 decimal places.
Test statistic:___
___
Answer: 7.3315
Hide ques!on 1 feedback
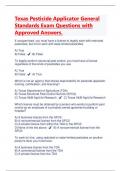
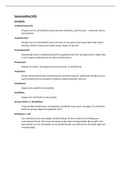
0-0.99 1-1.99 2-2.99 3-4.00
Observed
19 28 82 71
Counts
Expected =200*0.07 =200*.21= =200*.37 =200*.35
Counts =14 42 = 74 = 70
, Test Stat =
(19 − 14) 2 (28 − 42) 2 (82 − 74) 2 (71 − 70) 2
+ + +
14 42 74 70
Test Stat = 7.331532
Question 2 point
Students at a high school are asked to evaluate their experience in the class at the end of each school year.
The courses are evaluated on a 1-4 scale – with 4 being the best experience possible. In the History
Department, the courses typically are evaluated at 10% 1's, 15% 2's, 34% 3's, and 41% 4's.
Mr. Goodman sets a goal to outscore these numbers. At the end of the year he takes a random sample of
his evaluations and finds 10 1's, 13 2's, 48 3's, and 52 4's. At the 0.05 level of significance, can Mr.
Goodman claim that his evaluations are significantly different than the History Department's?
yes, the p-value = 0.5893
no, the p-value = 0.5893
no, the p-value = 0.3913
yes, the p-value = 0.3913
Hide ques!on 2 feedback
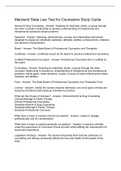
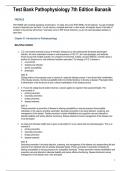
1's 2's 3's 4's
Observed
10 13 48 52
Counts
Expected 123 *.10 123*.15 = 123*.34 = 123*.41
Counts = 12.3 18.45 41.82 = 50.43
Use Excel to find the p-value
=CHISQ.TEST(Highlight Observed, Highlight Expected)
p-value > .05, Do Not Reject Ho. No, this is not significant.
Question 3 point
Pamplona, Spain is the home of the festival of San Fermin – The Running of the Bulls. The town is in festival mode for a week and a half
every year at the beginning of July. There is a running joke in the city, that Pamplona has a baby boom every April – 9 months after San
Fermin. To test this claim, a resident takes a random sample of 300 birthdays from native residents and finds the following observed
counts:
January 25
February 25
March 27
April 26
, May 21
June 26
July 22
August 27
September 21
October 26
November 28
December 26
At the 0.05 level of significance, can it be concluded that births in Pamplona are not equally distributed throughout the 12 months of the
year?
Hypotheses:
H0: Births in Pamplona ______ equally distributed throughout the year.
H1: Births in Pamplona ______ equally distributed throughout the year.
Select the best fit choices that fit in the two blank spaces above.
are, are not
are not, are
are, are
are not, are not
Question 4 point
A Driver's Ed program is curious if the time of year has an impact on number of car accidents in the U.S.
They assume that weather may have a significant impact on the ability of drivers to control their vehicles.
They take a random sample of 150 car accidents and record the season each occurred in. They found that
27 occurred in the Spring, 39 in the Summer, 31 in the Fall, and 53 in the Winter.
Can it be concluded at the 0.05 level of significance that car accidents are not equally distributed
throughout the year?
yes because the p-value = 0.0145
no, because the p-value = 0.0145
yes, because the p-value = 0.0291
no, because the p-value = 0.0291
Hide ques!on 4 feedback
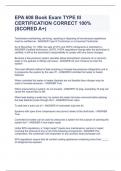
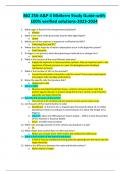
Spring SummerFall Winter
Observed
27 39 31 53
Counts
Expected 150*.25150*.25 150*.25150*.25=
Counts = 37.5 = 37.5 = 37.5 37.5
You can use Excel to find the p-value
=CHISQ.TEST(Highlight Observed, Highlight Expected)
p-value = 0.0145 < .05, Reject Ho, Yes, this is significant
1
2
Your work has been saved and submitted
Written Jan 24, 2024 7:30 PM - Jan 24, 2024 8:14 PM • Attempt 1 of 4
Attempt Score 19. - 98.34 %
Overall Grade (Highest Attempt) 19. - 98.34 %
Question 1 point
A college prep school advertises that their students are more prepared to succeed in college than other
schools. To verify this, they categorize GPA's into 4 groups and look up the proportion of students at a
state college in each category. They find that 7% have a 0-0.99, 21% have a 1-1.99, 37% have a 2-2.99,
and 35% have a 3-4.00 in GPA.
They then take a random sample of 200 of their graduates at the state college and find that 19 has a 0-
0.99, 28 have a 1-1.99, 82 have a 2-2.99, and 71 have a 3-4.00.
Can they conclude that the grades of their graduates are distributed differently than the general population
at the school? Test at the 0.05 level of significance.
Enter the test statistic - round to 4 decimal places.
Test statistic:___
___
Answer: 7.3315
Hide ques!on 1 feedback
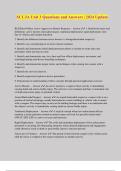
0-0.99 1-1.99 2-2.99 3-4.00
Observed
19 28 82 71
Counts
Expected =200*0.07 =200*.21= =200*.37 =200*.35
Counts =14 42 = 74 = 70
, Test Stat =
(19 − 14) 2 (28 − 42) 2 (82 − 74) 2 (71 − 70) 2
+ + +
14 42 74 70
Test Stat = 7.331532
Question 2 point
Students at a high school are asked to evaluate their experience in the class at the end of each school year.
The courses are evaluated on a 1-4 scale – with 4 being the best experience possible. In the History
Department, the courses typically are evaluated at 10% 1's, 15% 2's, 34% 3's, and 41% 4's.
Mr. Goodman sets a goal to outscore these numbers. At the end of the year he takes a random sample of
his evaluations and finds 10 1's, 13 2's, 48 3's, and 52 4's. At the 0.05 level of significance, can Mr.
Goodman claim that his evaluations are significantly different than the History Department's?
yes, the p-value = 0.5893
no, the p-value = 0.5893
no, the p-value = 0.3913
yes, the p-value = 0.3913
Hide ques!on 2 feedback
1's 2's 3's 4's
Observed
10 13 48 52
Counts
Expected 123 *.10 123*.15 = 123*.34 = 123*.41
Counts = 12.3 18.45 41.82 = 50.43
Use Excel to find the p-value
=CHISQ.TEST(Highlight Observed, Highlight Expected)
p-value > .05, Do Not Reject Ho. No, this is not significant.
Question 3 point
Pamplona, Spain is the home of the festival of San Fermin – The Running of the Bulls. The town is in festival mode for a week and a half
every year at the beginning of July. There is a running joke in the city, that Pamplona has a baby boom every April – 9 months after San
Fermin. To test this claim, a resident takes a random sample of 300 birthdays from native residents and finds the following observed
counts:
January 25
February 25
March 27
April 26
, May 21
June 26
July 22
August 27
September 21
October 26
November 28
December 26
At the 0.05 level of significance, can it be concluded that births in Pamplona are not equally distributed throughout the 12 months of the
year?
Hypotheses:
H0: Births in Pamplona ______ equally distributed throughout the year.
H1: Births in Pamplona ______ equally distributed throughout the year.
Select the best fit choices that fit in the two blank spaces above.
are, are not
are not, are
are, are
are not, are not
Question 4 point
A Driver's Ed program is curious if the time of year has an impact on number of car accidents in the U.S.
They assume that weather may have a significant impact on the ability of drivers to control their vehicles.
They take a random sample of 150 car accidents and record the season each occurred in. They found that
27 occurred in the Spring, 39 in the Summer, 31 in the Fall, and 53 in the Winter.
Can it be concluded at the 0.05 level of significance that car accidents are not equally distributed
throughout the year?
yes because the p-value = 0.0145
no, because the p-value = 0.0145
yes, because the p-value = 0.0291
no, because the p-value = 0.0291
Hide ques!on 4 feedback
Spring SummerFall Winter
Observed
27 39 31 53
Counts
Expected 150*.25150*.25 150*.25150*.25=
Counts = 37.5 = 37.5 = 37.5 37.5
You can use Excel to find the p-value
=CHISQ.TEST(Highlight Observed, Highlight Expected)
p-value = 0.0145 < .05, Reject Ho, Yes, this is significant