This documents give a brief yet deep basic understanding in using Stata as a statistical programming application. With Stata, you could do some research, forecasting, analyzing, etc. that uses basic principal of statistics. Stata is widely use on research purposes. This practice questions is used a...
Test Bank For Introductory Econometrics: A Modern Approach 7th Edition By Jeffrey M. Wooldridge
ECON0019 (Quantitative Economics and Econometrics) Term 2 Summary - UCL Economics BSc Second Year
ECON0019 (Quantitative Economics and Econometrics) Term 1 Summary - UCL Economics BSc Second Year
All for this textbook (13)
Written for
Padjadjaran University
Economics
Introductory of Econometrics with Stata
All documents for this subject (1)
Seller
Follow
nicholasrds
Content preview
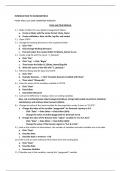
INTRODUCTION TO ECONOMETRICS
POINT AND CLICK DAN COMMAND WINDOW
Point and Click Method.
1.) Make 4 folders for your global management folders
a. Create a folder with the name format: Stata_Name
b. Create subfolders: data, do-file, log-file, and output
2.) Open STATA
3.) Change the working directory to the respective folder
a. Click "File"
b. Click Change Working Directory
c. Find and select the created folder (C:\(Stata_Name) to use
4.) Create a log file with the name "1_StataLab"
a. Click "File"
b. Click "Log" -> Click "Begin"
c. Then locate the folder (C:\(Stata_Name)\log-file
d. Write the name of the dile with "1_StataLab "
5.) Retrieve lifeexp.dta file data into STATA
a. Click "Flie"
b. Example datasets.. -> Click "Example datasets installed with Stata"
c. Then select "lifeexp.dta"
6.) View the values of the variables available in STATA
a. Click "Data"
b. Data Editor
c. Data Editor (Browse)
7.) Look at the difference in display colors on existing variables
blue, red, and black)/value label (categorical) (blue), string (red) (unable to perform statistical
calculations), and ordinary data (numeric) (black)
8.) Change the value of the island variable for the population under 5 years to "33,572"
a. Change the value of the variable "popgrowth" for Denmark country to 0.4
- Click "Data" -> Data Editor -> Data Editor (Edit)
- Change the value of varibel popgrowth for Denmark to 0.4
b. Change the value of the Russian state "region" variable to "Eur & C.Asia"
- Click "Data" -> Data Editor -> Data Editor (Edit)
- Change the value of the Russian region to "Eur & C.Asia"
9.) Look at the number of observations, the number of variables and what variables are in the data
a. Click "Data"
b. Describe Data
c. Describe data in memory -> OK
10.) Take a look at some statistical information from the existing data
a. Click "Data"
b. Describe Data
c. Summary Statistics
11.) Tabulate one of the variables, namely the "popgrowth" variable
The benefits of buying summaries with Stuvia:
Guaranteed quality through customer reviews
Stuvia customers have reviewed more than 700,000 summaries. This how you know that you are buying the best documents.
Quick and easy check-out
You can quickly pay through credit card or Stuvia-credit for the summaries. There is no membership needed.
Focus on what matters
Your fellow students write the study notes themselves, which is why the documents are always reliable and up-to-date. This ensures you quickly get to the core!
Frequently asked questions
What do I get when I buy this document?
You get a PDF, available immediately after your purchase. The purchased document is accessible anytime, anywhere and indefinitely through your profile.
Satisfaction guarantee: how does it work?
Our satisfaction guarantee ensures that you always find a study document that suits you well. You fill out a form, and our customer service team takes care of the rest.
Who am I buying these notes from?
Stuvia is a marketplace, so you are not buying this document from us, but from seller nicholasrds. Stuvia facilitates payment to the seller.
Will I be stuck with a subscription?
No, you only buy these notes for $0.00. You're not tied to anything after your purchase.