NL: Summary includes all HOC given in 2024 (slides + book + notes).
The summary is long, but because there are many graphs and models, it ensures that the pages are filled quickly. Don't worry, it's faster than you think:)
EN: Summary includes all HOC given in 2024 (slides + book + notes).
Th...
Chapter 2: National Income Accounting and the Balance
Payments
1. National Income Accounts
The national income accounting records all the expenditures that contribute to a country’s income and output.
The balance of payment accounting helps us keep track of both changes in a country’s indebtedness to
foreigners and the fortunes of its export- and import-competing industries. This also show the connection
between foreign transactions and national money supplies.
The value of the national income results from production and expenditure.
- Often defined to be the income earned by a nation’s factor of production.
Factors of production:
- Land, labor, entrepreneurship, and capital.
The national income identity says that gross domestic product (GDP) is given by consumption expenditure,
investment expenditure, government expenditure and net export (export – import). Producers earn income
from buyers who spend money on goods and services. The amount of expenditure by buyers is equal to the
amount of income for sellers (is the value of production).
The first task in understanding how economists analyze GNP is to explain in greater detail why the GNP of a
country generates over time period (national product) must equal its national income.
➔ National income identity: national product = national income
The reason for this equality is that every $ used to purchase goods or services automatically ends up in
somebody’s pocket.
Example: A visit to the doctor: the pay of $75 represents the market value of the services he provides to you, so
your visit raises GNP by $75. But the $75 you pay the doctor also raises his income. So national income rises by
$75.
National Income Accounts: GNP
Gross national product (GNP) measures the total economic output produced by a country’s residents,
regardless of where they are located. It includes the value of all goods and services produced by a country’s
citizens, both domestically and abroad, within a specific time. Important indicator to assess a country’s overall
economic performance and standard of living. It is calculated by adding up the market value of all
expenditures on final output.
Example: includes the value of bread sold in a supermarket or textbooks sold in a bookstore as well as the value
of services provided by stockbrokers and plumbers.
Gross national product (GNP) is related to the gross domestic product (GDP), which considers all output
produced withing a country’s borders regardless of who owns the means of production.
GNP is calculated by adding the value of expenditure on final goods and services produced:
- Consumption: expenditure by domestic consumers
- Investments: expenditure by firms on buildings and equipment
- Government purchases: expenditure by governments on goods and services
- Current account balance: net expenditure by foreigners on domestic goods and services
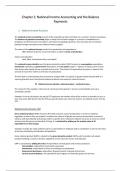
, Figure 2.1 U.S. GNP and its components
America’s gross national product (GNP) for Q1 of 2020 can be broken down into the four components shown
(consumption, investment, government purchases, current account)
Why is it useful to divide GNP into consumption, investment, government purchases and the current
accounts?
1) We cannot hope to understand the cause of a particular recession of boom without knowing how the
main categories of spending have changed (and without that understanding, we cannot provide any
policy response)
2) The national income accounts provide information essential for studying why some countries are rich,
while others are poor (rich: high level of GNP relative to population). So, it’s possible to compare
countries with different population sizes.
Graph: Current accounts of US are negative
- The US have had a negative current account for years now, what has important financial implications
(see later)
Breaking down GDP … Europe, 2004
Cartoon: Compares fatty Germany with
fit France and Spain:
- Shows the German economy is
not doing very well in 2004.
The graph shows a remarkable example
of 2 economies that are very different
from each other in 2004 (France and
Germany). Important is that the graph
does not measure absolute values, but
contributions to the GDP growth in
percentage points.
France Germany
Consumer spending Very good Very low
Investment Low Negative
Government spending Good Very low
Net export Negative Very high
Total GDP +/- 4.5% +/- 2%
,France is primary led by consumption spending and government spending as where Germany is primary led by
net exports.
➔ This shows it is important to look at all the components of GNP to make an analysis of a country.
Breaking down GDP … Europe, 2012-2015
“Consumption has only grown relatively modestly, and investment scarcely at all, in Germany and the rest of
the core. Instead, core and periphery alike have relied on international demand for their exports. Between
2011 and 2015 the euro area’s trade surplus rose from just 0.1% of euro-zone GDP to 3.7%.”
“Europe’s addiction to exports leaves it vulnerable to any deceleration in global growth. Were China’s
economy to slow more sharply, or America’s to return to recession, Europe, too, would see growth wane.”
Germany is the country that contributed the most to the GDP growth in Europe between 2012 and 2015, which
consists in more than 50%. It has been followed by France and the Netherlands. For the rest of the euro area,
we see that net exports have been the most important component.
Breaking down GDP … China, 2007
It is remarkable to see in the graph that China has incredible growth rates (up to
11%).
“China’s economy is driven not by exports, but by investment, which accounts for
over 40% of the GDP. Since 2005, net exports have contributed to more than 20%
of growth.
In China, contributions of household consumption are lower than in the West.
→ This shows that China’s economy is unbalanced.
We have 2 important points to analyze here:
, 1) We need to look at the growth levels.
o 2006: Growth of 11% is not sustainable because it is too fast to grow (an economy cannot
grow that fast on a long period)
2) We need the correct picture of China.
o We often haver a wrong image of China’s economy. We often interpret China with a lot of
export. That is not wrong, but it’s also not complete. Investments in China are also very
important, if not even more (40% of GDP)
Breaking down GDP … China, 2009
Martin Wolf, economist at the Financial Times: “in the longer term, China needs to rebalance its economy, by
increasing consumption. It is important to understand how distorted China’s economy now is: in 2007,
personal consumption was just 35% of GDP. Meanwhile, China was investing 11% of GDP in low-yielding
foreign asserts, via its current account surplus. Remember how poor hundreds of millions of Chinese still are.
Then consider that the net transfer of resources abroad was equal to a third of personal consumption.”
What are the financial implications of this?
- A current account deficit means you borrow money from the rest of the world. As China is investing a
lot in (low yielding) foreign assets, that means they cannot be invested domestically. This raises
ethical questions: hundreds of millions of Chinese are poor. The money that flows out of China for
investments could have been put to better uses.
Breaking down GDP … China, 2010
Michael Pettis of Peking University’s Guanghua School of Management:
“Chinese growth is unbalanced. It is highly dependent on investment as a
source of demand and driven of supply. It is, in a sense, the most capitalist
economy ever.”
Thus, between 1997 and 2009, gross investment rose from 32% to 46% of
GDP, while household consumption fell from 45% to 36%. This must be the
lowest share of consumption in any significant economy ever. In a country
with hundreds of millions of poor people, it is even shocking.
Why the most capitalist economy ever?
- China is highly dependent on investments as a source of demand.
Breaking down GDP … China, 2013
The benefits of buying summaries with Stuvia:
Guaranteed quality through customer reviews
Stuvia customers have reviewed more than 700,000 summaries. This how you know that you are buying the best documents.
Quick and easy check-out
You can quickly pay through credit card or Stuvia-credit for the summaries. There is no membership needed.
Focus on what matters
Your fellow students write the study notes themselves, which is why the documents are always reliable and up-to-date. This ensures you quickly get to the core!
Frequently asked questions
What do I get when I buy this document?
You get a PDF, available immediately after your purchase. The purchased document is accessible anytime, anywhere and indefinitely through your profile.
Satisfaction guarantee: how does it work?
Our satisfaction guarantee ensures that you always find a study document that suits you well. You fill out a form, and our customer service team takes care of the rest.
Who am I buying these notes from?
Stuvia is a marketplace, so you are not buying this document from us, but from seller lockrondonck. Stuvia facilitates payment to the seller.
Will I be stuck with a subscription?
No, you only buy these notes for $11.72. You're not tied to anything after your purchase.