100% satisfaction guarantee Immediately available after payment Both online and in PDF No strings attached
logo-home
statistiek 2 samenvatting statistische testen $11.45
Add to cart

Summary

statistiek 2 samenvatting statistische testen

 5 views  0 purchase
  • Course
  • Institution

samenvatting van de statistische testen, alles wat je theoretisch per test moet weten om de oefeningen te kunnen maken

Preview 2 out of 9  pages

  • July 6, 2024
  • 9
  • 2023/2024
  • Summary
avatar-seller
1


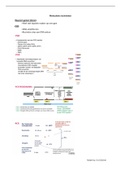
Ongepaarde t-test
- Continue variabele die normaal verdeeld is in elke groep
- Gelijke varianties
 test van levene (resultaat krijg je door t-test te runnen)

altijd α= 0.05

H 0 : μ1=μ2 2 2
H 0 : σ 1=σ 2
H 1 : eenzijdig μ1 > μ2 of μ1 < μ2
tweezijdig μ1 ≠ μ2 H 1 : σ 21 ≠ σ 22


Teststatistiek


x 1−x 2 pooled standaarddeviatie S
t= t n +n −2 ( n1 −1 ) S21 +(n2−1) S 22

√ 1 1 1 2 S=
S + n1 +n2−2
n1 n 2


100(1-α)% betrouwbaarheidsinterval


[
tweezijdig ( x 1−x 2 )−t
n1+ n2−2 , 1−
α
2
∗S
√ 1 1
+ , ( x −x ) +t
n1 n2 1 2 n +n −2 ,1− α2
∗S
1
1 1
+
n1 n2
2 √ ]
linkszijdig ¿−∞ , ( x 1−x 2 )−t n +n −2 ,1−α ∗S
1 2
√ 1 1
+ ¿¿
n1 n2

rechtszijdig ¿
Descriptieve statistiek + grafische voorstelling
gemiddelde x
standaarddeviatie s

boxplot

, 2


Mann-Whitney U-test
- Continue variabele die niet normaal verdeeld is of bij ordinale variabele


H 0 :beide groepen hebben dezelfde distributie
H 1 : beide groepen hebben verschillende distributie

Teststatistiek
U−μ U U =min ( U 1 ,U 2 ) Rangsom W
z= N (0,1) Correctie voor ties t (= aantal
σU n1 (n 1+1) gelijke waarden)
U 1=n1 n 2+ −W 1 Totale steekproefgrootte
2 N=n1+ n2
n2 (n 2+1)
U 2=n1 n 2+ −W 2
2

n1 n2
μU =
2

σ U = √ n1 n2 ¿ ¿ ¿


Procedure

 Rangschik elke observatie (groepen samen gerangschikt maar apart genoteerd) van klein naar groot
 Ken een rangwaarde toe (rangen voor de 2 groepen samen maar apart genoteerd)
o Indien ties: een gemiddelde rang toekennen
o Indien ties: bereken t 3−t
 Bereken rangsom per groep: W 1 en W 2

Descriptieve statistiek + grafische voorstelling
Mediaan
interkwartielinterval

boxplot

The benefits of buying summaries with Stuvia:

Guaranteed quality through customer reviews

Guaranteed quality through customer reviews

Stuvia customers have reviewed more than 700,000 summaries. This how you know that you are buying the best documents.

Quick and easy check-out

Quick and easy check-out

You can quickly pay through credit card or Stuvia-credit for the summaries. There is no membership needed.

Focus on what matters

Focus on what matters

Your fellow students write the study notes themselves, which is why the documents are always reliable and up-to-date. This ensures you quickly get to the core!

Frequently asked questions

What do I get when I buy this document?

You get a PDF, available immediately after your purchase. The purchased document is accessible anytime, anywhere and indefinitely through your profile.

Satisfaction guarantee: how does it work?

Our satisfaction guarantee ensures that you always find a study document that suits you well. You fill out a form, and our customer service team takes care of the rest.

Who am I buying these notes from?

Stuvia is a marketplace, so you are not buying this document from us, but from seller alaska54. Stuvia facilitates payment to the seller.

Will I be stuck with a subscription?

No, you only buy these notes for $11.45. You're not tied to anything after your purchase.

Can Stuvia be trusted?

4.6 stars on Google & Trustpilot (+1000 reviews)

52510 documents were sold in the last 30 days

Founded in 2010, the go-to place to buy study notes for 14 years now

Start selling
$11.45
  • (0)
Add to cart
Added