WEEK 1
Lecture 1: Recap Lecture
Important matters for the application of statistics (Applied Statistics)
1. Selecting a sample from a population
2. Deciding whether a sample is representative
3. Descriptive or inferential statistics
4. Measurement levels (NOIR) and types of variables (categorical/ quantitative)
5. Selecting the correct statistical analysis
6. Experimental vs non-experimental research design
Methods (Design) & Statistics (Toolkit)
Important for the application of statistics (applied statistics)
Applied statistics: Selecting the correct statistical analysis (for the job).
Definition Statistics
Statistics = The science of collecting, organising, and interpreting numerical facts, which
we call data.
Statistics consists of a body of methods for obtaining and analysing data, to:
1. Design (research studies that)
2. Describe (the data to)
, 3. Make inferences based on these data.
Descriptive Statistics: Summarize sample or population data with numbers, tables, and
graphs. (E.g. Mean, Median, Mode)
Inferential Statistics: Make predictions about population parameters, based on a
(random) sample of data. (E.g. mean in the population)
Data, population, sample, reliability, validity
Doing research by means of data → 2 groups:
(1) Population: The total set of participants, relevant for the research question
● E.g. Population parameter: Average hours of self-study per week of all
students.
(2) Sample: A subtest of the population about who the data is collected
● E.g. Sample statistics: Average hours of self-study per week of a
randomly selected sample of 800 students.
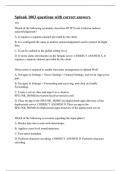
⇒ Good data is necessary to answer the research question, important for this:
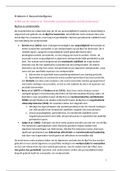
➢ Reliability (Precision)
➢ Validity (Bias)
- Reliable: When dots are together, not all over the place.
- Valid: When dots are hitting the target on average.
Descriptive Statistics
Variables, measurement levels, and range
Variable: Measure characteristics that can differ between subjects:
● In types of variables: Behavior-, stimulus-, subject-, and physiological variables.
● In Range
● In Measurement Scales (NOIR) ⇒
Categorical/ qualitative:
➔ Nominal: Unordered categories
◆ One is not higher than the other.
◆ (Eye color, biological sex)
➔ Ordinal: Ordered categories
◆ You can go from low to high.
◆ (Disagree/neutral/agree)
Numerical/ Quantitative
➔ Interval: Equal distance between consecutive values
◆ Equal distance: Step size is always the same.
, ◆ (°C)
➔ Ratio: Equal distance and true zero point
◆ This makes it allowed to say “2x as big”
◆ (K, age)
Range =
● Discrete: The measurement unit is indivisible (=ondeelbaar)
○ (Brothers/ sisters → You can have 0 brothers)
● Continuous: Infinitely divisible measurement unit
○ (Body height)
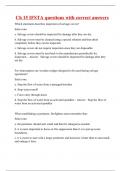
3 dimensions are important in descriptive statistics:
(1) Central tendency: Typical observation
● Mean, mode, median
(2) Dispersion: Variability in observations
● Standard deviation, variance, interquartile range
(3) Position: Relative position of the observation(s)
● Gives information about relative positions of observations
● Percentile, quartile
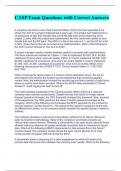
Q1: In which ways can you describe the (differences between) these two distributions?
→ Nation A and Nation B have the same mean, however the data of Nation A is much
more variable, while in Nation B it is less.
, Descriptive Statistics
Sample problems with inferential statistics
Goal: Reliable and valid statements about the population based on a sample
➢ Sample statics should not differ from the population parameter
Problems:
● Sampling error: Natural (random) sampling variation
→ There are differences between two random groups.
● Sampling bias: Selective sampling
→ Not representative for the whole population.
● Response bias: Incorrect answer
● Non-Response bias: Selective participation
●
→ Some answer, others do not answer.
Problems concerning reliability = Error
→ Fact of life, can not do anything about it, except for increasing sample size
Problems concerning validity = Bias
→ Problematic, makes it not representative for population.
Solution: A random sampling approach of sufficient size that generates data for everyone
approached, with correct responses on all items for all subjects.
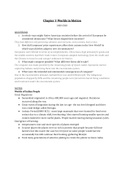
Dimensions of distributions
Population distribution:
❖ The proportion of students indicating the need for extra support
in mathematics.
Sample data distribution:
❖ The proportion of students in the sample (Here n=1000) indicates
the need for extra support in mathematics.
❖ (Unbiased sample → same distribution for population and sample)
Sampling distribution:
❖ Distribution of how the different samples related to each
other.
❖ The probability distribution for the sample statistic
(proportion/ mean/ regression coefficient). To interpret as a
result of repetitive taking of a sample of size n (here
n=1000)
❖ Sampling distribution is about Standard Error σM : Says
something about the precision of your estimate.
Lecture 1: Recap Lecture
Important matters for the application of statistics (Applied Statistics)
1. Selecting a sample from a population
2. Deciding whether a sample is representative
3. Descriptive or inferential statistics
4. Measurement levels (NOIR) and types of variables (categorical/ quantitative)
5. Selecting the correct statistical analysis
6. Experimental vs non-experimental research design
Methods (Design) & Statistics (Toolkit)
Important for the application of statistics (applied statistics)
Applied statistics: Selecting the correct statistical analysis (for the job).
Definition Statistics
Statistics = The science of collecting, organising, and interpreting numerical facts, which
we call data.
Statistics consists of a body of methods for obtaining and analysing data, to:
1. Design (research studies that)
2. Describe (the data to)
, 3. Make inferences based on these data.
Descriptive Statistics: Summarize sample or population data with numbers, tables, and
graphs. (E.g. Mean, Median, Mode)
Inferential Statistics: Make predictions about population parameters, based on a
(random) sample of data. (E.g. mean in the population)
Data, population, sample, reliability, validity
Doing research by means of data → 2 groups:
(1) Population: The total set of participants, relevant for the research question
● E.g. Population parameter: Average hours of self-study per week of all
students.
(2) Sample: A subtest of the population about who the data is collected
● E.g. Sample statistics: Average hours of self-study per week of a
randomly selected sample of 800 students.
⇒ Good data is necessary to answer the research question, important for this:
➢ Reliability (Precision)
➢ Validity (Bias)
- Reliable: When dots are together, not all over the place.
- Valid: When dots are hitting the target on average.
Descriptive Statistics
Variables, measurement levels, and range
Variable: Measure characteristics that can differ between subjects:
● In types of variables: Behavior-, stimulus-, subject-, and physiological variables.
● In Range
● In Measurement Scales (NOIR) ⇒
Categorical/ qualitative:
➔ Nominal: Unordered categories
◆ One is not higher than the other.
◆ (Eye color, biological sex)
➔ Ordinal: Ordered categories
◆ You can go from low to high.
◆ (Disagree/neutral/agree)
Numerical/ Quantitative
➔ Interval: Equal distance between consecutive values
◆ Equal distance: Step size is always the same.
, ◆ (°C)
➔ Ratio: Equal distance and true zero point
◆ This makes it allowed to say “2x as big”
◆ (K, age)
Range =
● Discrete: The measurement unit is indivisible (=ondeelbaar)
○ (Brothers/ sisters → You can have 0 brothers)
● Continuous: Infinitely divisible measurement unit
○ (Body height)
3 dimensions are important in descriptive statistics:
(1) Central tendency: Typical observation
● Mean, mode, median
(2) Dispersion: Variability in observations
● Standard deviation, variance, interquartile range
(3) Position: Relative position of the observation(s)
● Gives information about relative positions of observations
● Percentile, quartile
Q1: In which ways can you describe the (differences between) these two distributions?
→ Nation A and Nation B have the same mean, however the data of Nation A is much
more variable, while in Nation B it is less.
, Descriptive Statistics
Sample problems with inferential statistics
Goal: Reliable and valid statements about the population based on a sample
➢ Sample statics should not differ from the population parameter
Problems:
● Sampling error: Natural (random) sampling variation
→ There are differences between two random groups.
● Sampling bias: Selective sampling
→ Not representative for the whole population.
● Response bias: Incorrect answer
● Non-Response bias: Selective participation
●
→ Some answer, others do not answer.
Problems concerning reliability = Error
→ Fact of life, can not do anything about it, except for increasing sample size
Problems concerning validity = Bias
→ Problematic, makes it not representative for population.
Solution: A random sampling approach of sufficient size that generates data for everyone
approached, with correct responses on all items for all subjects.
Dimensions of distributions
Population distribution:
❖ The proportion of students indicating the need for extra support
in mathematics.
Sample data distribution:
❖ The proportion of students in the sample (Here n=1000) indicates
the need for extra support in mathematics.
❖ (Unbiased sample → same distribution for population and sample)
Sampling distribution:
❖ Distribution of how the different samples related to each
other.
❖ The probability distribution for the sample statistic
(proportion/ mean/ regression coefficient). To interpret as a
result of repetitive taking of a sample of size n (here
n=1000)
❖ Sampling distribution is about Standard Error σM : Says
something about the precision of your estimate.