EXAM Research & Statistics 7U9X0
1. What does a spurious relationship between 2 variables mean?
a. There is a relationship between the variables, but the relationship is non-linear
b. There is a relationship between the variables, but the relationship is not reliable
c. The correlation between the variables is not significant
d. There is a third variable that can explain the correlation between the variables
If one chooses to use interviewers instead of a self-reported (written) questionnaire, the risk of
getting social desirable answers (rather than true answers) on questions increases. On the other
hand, an interviewer can explain questions if the meaning of a question is not clear to a
respondent, thus this reduces the risk that different respondents understand a same question in
different ways.
2. What is your expectation about the quality of the measurement instrument if one changes
the method from self-reported to the use of an interviewer?
a. The reliability increases and the validity decreases
b. The reliability decreases and the validity increases
c. Both the reliability and validity increases
d. Both the reliability and validity decreases
Someone measures the behavior of the same sample of individuals before and a year after an
intervention is made in a neighborhood. A statistical test shows that the difference in behavior
between the before and after situation is significant.
3. Can one conclude based on this result that the relationship between the intervention and
the change in behavior is a causal relationship?
a. Yes, because the same individuals were measured before and after the intervention
b. No, because no control group was used
c. No, because only a sample of individuals was used
d. Yes, provided that a theory confirms the causal relationship
4. On which factors does the standard deviation of sample averages of some variable
depends on?
a. The variance of X, the mean of X and the size of the sample
b. Only the variance of X and the size of the sample
c. Only the variance of X and the mean of X
d. Only the variance of X
A researcher wants to investigate whether a relationship exists between age of visitors and the
type of theater – an urban or suburban theater – they visit. Age is measured and it formulates the
following hypotheses:
H0: there is no difference in average age between urban and suburban theater
H1: suburban theater visitors are older on average than urban theater visitors
5. Which t-test should the researcher use?
a. One-sample t-test
b. Paired samples t-test
c. Independent samples t-test
d. Post-hoc t-test
, 6. How should the test be conducted?
a. Given the hypotheses tested in this case: one-tailed
b. Given the hypotheses tested in this case: two-tailed
c. The t-test is always one-tailed
d. The t-test is always two-tailed
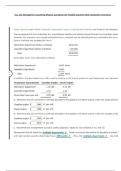
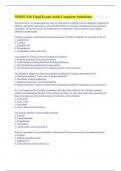
The researcher conducts the t-test in SPSS and obtains the following results:
Group Statistics
Std. error
Type N Mean Std. deviation
mean
Age Urban 196 26,01 10,267 ,733
Suburban 201 29,44 11,747 ,829
The results of the t-test
Levene’s Test for equality
t-test for equality of means
of variances
F Sig. t df Sig. (2-tailed)
Age Equal variances
8,545 ,004 -3,102 395
assumed
Equal variances
-3,107 390,375
not assumed
7. What does the result of the Levene’s test indicate?
a. We must assume that the variances are equal
b. We must assume that the variances are not equal
c. We must assume that the groups are independent
d. We must assume that the groups are not independent
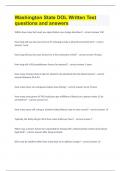
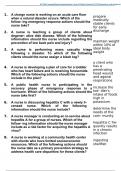
Descriptives
travtime
95% confidence interval for
N Mean Std. deviation Mean
Lower bound Upper bound
1 79 17,94 15,613 14,44 21,43
2 123 22,36 16,940 19,4 25,36
3 149 23,64 18,727 20,61 26,67
4 18 28,11 28,040 14,17 42,05
total 369 22,21 18,183 20,35 24,07
ANOVA
travtime
Sum of squares df Mean squares F Sig.
Between groups 2375,841 3 791,947 2,423 ,066
Within groups 119289,848 365 326,822
Total 121665,689 368
1. What does a spurious relationship between 2 variables mean?
a. There is a relationship between the variables, but the relationship is non-linear
b. There is a relationship between the variables, but the relationship is not reliable
c. The correlation between the variables is not significant
d. There is a third variable that can explain the correlation between the variables
If one chooses to use interviewers instead of a self-reported (written) questionnaire, the risk of
getting social desirable answers (rather than true answers) on questions increases. On the other
hand, an interviewer can explain questions if the meaning of a question is not clear to a
respondent, thus this reduces the risk that different respondents understand a same question in
different ways.
2. What is your expectation about the quality of the measurement instrument if one changes
the method from self-reported to the use of an interviewer?
a. The reliability increases and the validity decreases
b. The reliability decreases and the validity increases
c. Both the reliability and validity increases
d. Both the reliability and validity decreases
Someone measures the behavior of the same sample of individuals before and a year after an
intervention is made in a neighborhood. A statistical test shows that the difference in behavior
between the before and after situation is significant.
3. Can one conclude based on this result that the relationship between the intervention and
the change in behavior is a causal relationship?
a. Yes, because the same individuals were measured before and after the intervention
b. No, because no control group was used
c. No, because only a sample of individuals was used
d. Yes, provided that a theory confirms the causal relationship
4. On which factors does the standard deviation of sample averages of some variable
depends on?
a. The variance of X, the mean of X and the size of the sample
b. Only the variance of X and the size of the sample
c. Only the variance of X and the mean of X
d. Only the variance of X
A researcher wants to investigate whether a relationship exists between age of visitors and the
type of theater – an urban or suburban theater – they visit. Age is measured and it formulates the
following hypotheses:
H0: there is no difference in average age between urban and suburban theater
H1: suburban theater visitors are older on average than urban theater visitors
5. Which t-test should the researcher use?
a. One-sample t-test
b. Paired samples t-test
c. Independent samples t-test
d. Post-hoc t-test
, 6. How should the test be conducted?
a. Given the hypotheses tested in this case: one-tailed
b. Given the hypotheses tested in this case: two-tailed
c. The t-test is always one-tailed
d. The t-test is always two-tailed
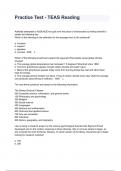
The researcher conducts the t-test in SPSS and obtains the following results:
Group Statistics
Std. error
Type N Mean Std. deviation
mean
Age Urban 196 26,01 10,267 ,733
Suburban 201 29,44 11,747 ,829
The results of the t-test
Levene’s Test for equality
t-test for equality of means
of variances
F Sig. t df Sig. (2-tailed)
Age Equal variances
8,545 ,004 -3,102 395
assumed
Equal variances
-3,107 390,375
not assumed
7. What does the result of the Levene’s test indicate?
a. We must assume that the variances are equal
b. We must assume that the variances are not equal
c. We must assume that the groups are independent
d. We must assume that the groups are not independent
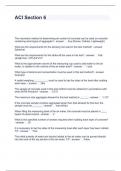
Descriptives
travtime
95% confidence interval for
N Mean Std. deviation Mean
Lower bound Upper bound
1 79 17,94 15,613 14,44 21,43
2 123 22,36 16,940 19,4 25,36
3 149 23,64 18,727 20,61 26,67
4 18 28,11 28,040 14,17 42,05
total 369 22,21 18,183 20,35 24,07
ANOVA
travtime
Sum of squares df Mean squares F Sig.
Between groups 2375,841 3 791,947 2,423 ,066
Within groups 119289,848 365 326,822
Total 121665,689 368