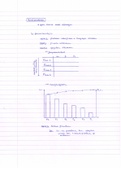
Supply Chain Management (SCM)
= a set of approaches utilized to efficiently integrate suppliers, manufacturers, warehouses, and stores, so
that merchandise is produced and distributed at the right quantities, and at the right time, in order to
minimize systemwide costs while satisfying service level requirements (value-adding processes)
# SCM network: supplier · manufacturers · warehouses and distribution centers · customers
Flow of products/services connected by transformation/storage activities from:
- raw materials manufacturers
- intermediate products manufacturers
- end product manufacturers * goal: reduce costs while improving service levels
- wholesalers/distributors
- retailers
Integration in all levels facilitated by information exchange, planning/financial and coordination activities
Key observations of SCM
· every facility that impacts costs needs to be considered
· efficiency and cost-effectiveness system required
> systems approach: interdependence and interactive nature of SC levels
· multiple levels of activities involved: strategic, tactical and operational
Strategic level (5+ years)
* design SC network: design enabling to match supply/demand by reducing costs
* procurement: overall procurement (=inkoop van materialen) strategy and select suppliers
Tactical level (3 months - 1 year) and operational level (day-to-day)
* forecast demand
* process orders: process customer requirements and perform commercial activities
* plan & manage inventory policy
* move product
* plan production: meet inventory replenishment requirements
Matching supply/demand (SCM) difficulties
1. SCM affected by development chain (=introduction of new products) and goals of organization
2. Minimizing systemwide costs, while maintaining/improving service levels (=global optimization)
, - complex network (globalization)
- facilities have other objectives/goals
- dynamic system as demand and importance of elements evolves over time
- system variations over time (time-varying demand and cost)
3. Managing uncertainty and risk
- matching supply and demand difficult (long in advance for production)
- inventory/back-orders fluctuate in amount further back in SC
- forecasts always wrong; soft orders that never materialize or demand/capacity change
- increased risk by recent trends of outsourcing/offshoring
> outsourcing: handing over activities to other firm
> offshoring: moving operations to country for cost reduction
An evolutionary perspective of SC
Early SC are simple with sole suppliers, limited interactions/transactions, few channel intermediaries:
* Fully integrated SC (Ford) | vertical integration of production, firm covers activities self if possible
* Disintegrated SC with geographical proximity (Toyota) | component and material suppliers are both
different firms, although located in the same geographic area
= geographical proximity (closeness) and herein integrated ownership structures
Modern SC are complex with fragmentation, globalization, proliferation (=increase) in SKU’s
Trends and developments
· in general logistics costs (transport, inventory and administrative costs) are lowering
> hereof transportation costs increased in % share in recent years
· online sales increase, mostly for the travelling sector
· order fulfillment influences customer loyalty majorly
· multi-channel or alternative delivery options are growing; parcellockers, click & collect
· integration of technologies; texting customers
Operations/processes in SC can be executed via a push or pull system
- push: execution is in anticipation of customer orders (speculative, independent, batches)
> schedule work on information outside, exogenous to, the system without limits, stock
- pull: execution is in response of a customer order (reactive, dependent, exact quantity)
> schedule work on information inside the system of limited items in WIP, no stock
2
,De Kok: “the pull system can be considered as a special case of the push system”
Preliminary, introductionary, inventory modelling issues
= Describing demand
* dependent (component parts of product) or independent (finished product) demand; other lead times
* stationary (same in all periods) or non-stationary (changing) demand; equal lead time
> stationary demand
> non-stationary demand
= Estimating relevant costs
* costs relating an order
* inventory holding costs
* shortage costs
Inventory management framework / exploring demand (by probability density/cumulative distribution)
Managing product assortment
Pareto principle: +- 20% of the total SKUs counts for 80% of the total annual sales volume
> online sales make long tail (niche products) fatter as more hereof is sold than in offline sales
A-B-C classification: inventory categorization technique to identify
· Class A, first 10-20% of SKUs, around 50-75% of sales volume (mostly 20%)
= should be monitored closely
· Class B, next 30-50% of SKUs, around 20%-30% of sales volume (mostly 30%)
= require a moderate yet significant amount of attention
3
, · Class C, remaining SKUs, remaining 5 to 10% of sales volume (mostly 50%)
= decision systems must be kept as simple as possible
+ equal availability (service level) for all classes; but more efficient to set separate service levels
+ classification of items based on single criteria (demand sales value or volume), better to
incorporate more factors as item criticality, required customer service so multi-dimensional
Inventory decision-making: balancing the costs of too large inventory with costs of too little inventory
Single item, single period inventory management - Newsvendor model
= inventory model for single items during a single period, days-months, in which only one opportunity
exists to determine the order quantity to fulfill demand (often seasonal goods with long lead times)
§ only in uncertain demand, due to non-stationary order quantity
§ determine inventory based on (discrete or continuous) probability distribution
§ approach - (1) describe demand and (2) describe relevant costs
§ data required: p (unit sales price), c (unit cost), s (salvage value)
Discrete demand: variable with well-defined finite set of possible values
= discrete probability distribution, each value has specific probabilities so tabular form of demand per Q
> marginal analysis increase order quantity (Q) till no longer profitable
· calculate decision-rule of probability demand > quantity so profit > loss; P(D>=Q)
· P(D>=Q) = (c-s)/(p-s)
· increase Q per unit as long as P(D) >= decision-rule value for Q*
· profit for given D and Q = D * p + (Q-D) * s - Q * c
Continuous demand: variable taking any value between two specified values (1,0934)
= continuous probability function or probabilty density function “pdf”, normal distribution with µ, s
> determine critical ratio/fractile (CR): area of distribution amassed by Q*
· CR = P(D<Q) = cost of underage (Cu) / cost of underage (Cu) + overage (Co)
· Q* = µ + (z*s)
2.1
4
The benefits of buying summaries with Stuvia:
Guaranteed quality through customer reviews
Stuvia customers have reviewed more than 700,000 summaries. This how you know that you are buying the best documents.
Quick and easy check-out
You can quickly pay through credit card or Stuvia-credit for the summaries. There is no membership needed.
Focus on what matters
Your fellow students write the study notes themselves, which is why the documents are always reliable and up-to-date. This ensures you quickly get to the core!
Frequently asked questions
What do I get when I buy this document?
You get a PDF, available immediately after your purchase. The purchased document is accessible anytime, anywhere and indefinitely through your profile.
Satisfaction guarantee: how does it work?
Our satisfaction guarantee ensures that you always find a study document that suits you well. You fill out a form, and our customer service team takes care of the rest.
Who am I buying these notes from?
Stuvia is a marketplace, so you are not buying this document from us, but from seller fabienne1234. Stuvia facilitates payment to the seller.
Will I be stuck with a subscription?
No, you only buy these notes for $5.89. You're not tied to anything after your purchase.