Practice Quiz 1
1)
If an independent variable has a p-value of 0.0050, which of the following could
represent the Lower 95% and the Upper 95% for that variable?
-235.62; -5.64
correct
The p-value, 0.0050, is less than 0.05 so the independent variable is significant at the
5% significance level. Therefore, the 95% confidence interval for the coefficient of the
independent variable does not include zero. The interval between -235.62 and -5.64
does not contain zero.
-11.23; 6.76
The p-value, 0.0050, is less than 0.05 so the independent variable is significant at the
5% significance level. Therefore, the 95% confidence interval for the coefficient of the
independent variable does not include zero. The interval between -11.23 and 6.76
contains zero.
-0.01; 0.03
The p-value, 0.0050, is less than 0.05 so the independent variable is significant at the
5% significance level. Therefore, the 95% confidence interval for the coefficient of the
independent variable does not include zero. The interval between -0.01 and 0.03
contains zero.
The answer cannot be determined without further information
The p-value, 0.0050, is less than 0.05 so the independent variable is significant at the
5% significance level. Therefore, the 95% confidence interval for the coefficient of the
independent variable does not include zero.
, 2)
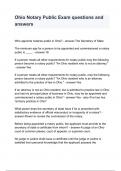
For a standard normal distribution (µ=0, σ=1), the area under the curve less than 1.5 is
93.32%. What is the approximate percentage of the area under the curve less than -1.5?
93.32%
93.32% is the area under the curve less than 1.5.
43.32%
43.32% is the area under the curve greater than 0 but less than 1.5.
13.36%
13.36% is the area under the curve less than -1.5 and greater than 1.5.
6.68%
correct
1–93.32%=6.68% is the area under the curve greater than 1.5. Since the normal
distribution is symmetric, 6.68% is also the area under the curve less than -1.5.
3) A professor presents a summary of grades to her students. A student asks why
the mean of the data set is so much smaller than the median. Which of the
following is most likely?
The distribution of the data is symmetric
When the distribution of data is symmetric, the mean and median are equal.
The distribution of the data is skewed to the left
correct
When the distribution of data is skewed to the left, the mean is most likely less than the
median. The extreme values in the left tail pull the mean towards them.
The distribution of the data is skewed to the right
When the distribution of data is skewed to the right, the mean is most likely greater than
the median. The extreme values in the right tail pull the mean towards them.
The distribution of the data is bimodal
When the distribution of data is bimodal, the mean may be less than, equal to, or greater
than the median.
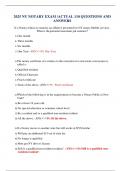
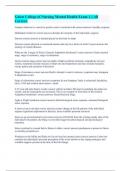
, 4) The scatter plot below displays the relationship between two variables. Which of
the following options most accurately describes the R 2 value and the p-value of
this relationship?
High R2; high p-value (i.e., p-value greater than 0.05)
A high R2 and high p-value indicates that the independent variable explains a lot of the
variation in the dependent variable but the linear relationship is not significant.
High R2; low p-value (i.e., p-value less than 0.05)
A high R2 and low p-value indicates that the independent variable explains a lot of the
variation in the dependent variable and the linear relationship is significant.
Low R2; high p-value (i.e., p-value greater than 0.05)
correct
A low R2 and high p-value indicates that the independent variable explains little variation
in the dependent variable and the linear relationship is not significant. Since the data
points are widely dispersed and do not indicate a clear linear pattern, this relationship
likely has a low R2 and high p-value.
Low R2; low p-value (i.e., p-value less than 0.05)
A low R2 and low p-value indicates that the independent variable explains little variation
in the dependent variable but the linear relationship is significant.
1)
If an independent variable has a p-value of 0.0050, which of the following could
represent the Lower 95% and the Upper 95% for that variable?
-235.62; -5.64
correct
The p-value, 0.0050, is less than 0.05 so the independent variable is significant at the
5% significance level. Therefore, the 95% confidence interval for the coefficient of the
independent variable does not include zero. The interval between -235.62 and -5.64
does not contain zero.
-11.23; 6.76
The p-value, 0.0050, is less than 0.05 so the independent variable is significant at the
5% significance level. Therefore, the 95% confidence interval for the coefficient of the
independent variable does not include zero. The interval between -11.23 and 6.76
contains zero.
-0.01; 0.03
The p-value, 0.0050, is less than 0.05 so the independent variable is significant at the
5% significance level. Therefore, the 95% confidence interval for the coefficient of the
independent variable does not include zero. The interval between -0.01 and 0.03
contains zero.
The answer cannot be determined without further information
The p-value, 0.0050, is less than 0.05 so the independent variable is significant at the
5% significance level. Therefore, the 95% confidence interval for the coefficient of the
independent variable does not include zero.
, 2)
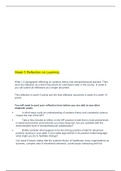
For a standard normal distribution (µ=0, σ=1), the area under the curve less than 1.5 is
93.32%. What is the approximate percentage of the area under the curve less than -1.5?
93.32%
93.32% is the area under the curve less than 1.5.
43.32%
43.32% is the area under the curve greater than 0 but less than 1.5.
13.36%
13.36% is the area under the curve less than -1.5 and greater than 1.5.
6.68%
correct
1–93.32%=6.68% is the area under the curve greater than 1.5. Since the normal
distribution is symmetric, 6.68% is also the area under the curve less than -1.5.
3) A professor presents a summary of grades to her students. A student asks why
the mean of the data set is so much smaller than the median. Which of the
following is most likely?
The distribution of the data is symmetric
When the distribution of data is symmetric, the mean and median are equal.
The distribution of the data is skewed to the left
correct
When the distribution of data is skewed to the left, the mean is most likely less than the
median. The extreme values in the left tail pull the mean towards them.
The distribution of the data is skewed to the right
When the distribution of data is skewed to the right, the mean is most likely greater than
the median. The extreme values in the right tail pull the mean towards them.
The distribution of the data is bimodal
When the distribution of data is bimodal, the mean may be less than, equal to, or greater
than the median.
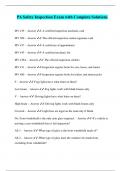
, 4) The scatter plot below displays the relationship between two variables. Which of
the following options most accurately describes the R 2 value and the p-value of
this relationship?
High R2; high p-value (i.e., p-value greater than 0.05)
A high R2 and high p-value indicates that the independent variable explains a lot of the
variation in the dependent variable but the linear relationship is not significant.
High R2; low p-value (i.e., p-value less than 0.05)
A high R2 and low p-value indicates that the independent variable explains a lot of the
variation in the dependent variable and the linear relationship is significant.
Low R2; high p-value (i.e., p-value greater than 0.05)
correct
A low R2 and high p-value indicates that the independent variable explains little variation
in the dependent variable and the linear relationship is not significant. Since the data
points are widely dispersed and do not indicate a clear linear pattern, this relationship
likely has a low R2 and high p-value.
Low R2; low p-value (i.e., p-value less than 0.05)
A low R2 and low p-value indicates that the independent variable explains little variation
in the dependent variable but the linear relationship is significant.