Victoria Daneau - 2024
Algemeen SPSS : Verkennen van data
Outliers (extreme values)
Cijfermatig
Analyze -> descriptive statistics -> explore -> variabele kiezen -> statistics -> outliers
In tabel Extreme Values kijken
Cijfermatig via z-score
Stap 1: Analyze -> descriptive statistics -> descriptives -> variabele kiezen -> save
standardized values aanklikken -> ok
Stap 2: In data view je eerste variabele op “sort ascending” plaatsen
Stap 3: Je tweede variabele dat in Z-score staat op “sort ascending” plaatsen
Z-score onder -3 zijn extreem laag
Stap 4: In data view je eerste variabele op “sort descending” plaatsen
Stap 5: Je tweede variabele dat in Z-score staat op “sort descending” plaatsen en tabel
slepen naast je eerste variabele
Z-score vanaf 3 zijn extreem hoog
Grafisch
Analyze -> descriptive statistics -> explore -> variabele kiezen AV en factor list variabele
kiezen OV -> statistics -> outliers
° outliers
* extremes
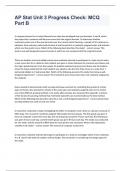
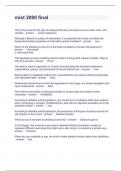
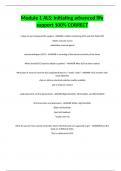
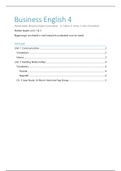
Univariaat Bivariaat Multivariaat
Mahalanobis D²
Frequentieverdeling / Spreidingsdiagram
(afstand van observatie tot
Histogram / boxplot (scatterplot)
midden van alle observaties)
n 80
absolute z-scores > 2.5 (“conservatief” gebruiken,
Beoordeling op zicht
n > 80 =.001)
absolute z-scores > 3 of 4
Percentielen
Analyze -> descriptive statistics -> explore -> statistics -> percentielen
Histogram
Analyze -> descriptive statistics -> explore -> plots -> histogram
, Victoria Daneau - 2024
Aantal cases met geldige waarnemingen voor alle variabelen/ nagaan waar er een
ontbrekende waarde is
Analyze -> descriptive statistics -> descriptives -> alle variabelen aanduiden -> ok -> Valid N
(listwise) helemaal onderaan in tabel
Bv. Valid N= 171 -> voor 171 cases zijn alle gegevens ingevuld. Er zijn hiervoor geen missings
Gemiddelde zonder de 5% uiterste waarnemingen
Analyze -> descriptive statistics -> explore -> variabele aanduiden in dependent variabele ->
ok -> 5% trimmed mean in tabel
Kijken naar verschil tussen normaal gemiddelde en 5% trimmed mean -> indien dat verschil
klein is dan zijn er niet veel extreme waarden
Histogram
Graphs -> histogram -> variabele kiezen
Histogram met normaalverdeling op
Graphs -> histogram -> variabele kiezen -> display normal curve aanduiden
OF
Dubbel klik op je histogram afbeelding -> elements -> show distribution curve
Boxplot voor vergelijking van twee groepen
Graphs -> boxplot -> simple en summaries for groups of cases -> AV in variabele -> variabele
waarvoor je groepen wilt in category axis (=factor)
Voorwaarde 1: Nagaan of items Reversed Coded zijn
Eerste manier
Variabele score aanmaken in transform -> compute variable -> target variabele “score” ->
Function group: statistical -> Functions and Special Variables: Sum(item…to item…)
Analyze -> correlate -> bivariate -> alle items selecteren -> paste -> aanpassen in syntax:
“item… tot item… WITH score.”
Positieve correlatie (enkel teken) -> alle items in zelfde richting
Negatieve correaltie (enkel teken) -> alle items niet in zelfde richting
Indien negatieve correlatie -> gaan hercoderen
Transform -> Recode into Different Variables -> item selecteren -> Name: item116bis ->
change -> Old and new values -> Value laagste value bv. 0 -> New Value hoogste value bv. 6
-> Add -> Value 1 -> New Value 5 -> Add -> Value 2 -> New Value 4 -> Add -> Value 3 -> New
Value 3 -> Add -> Value 4 -> New value 2 -> Add -> Value 5 -> New value 1 Add -> -> Value 6.
-> New value 0 -> Add -> continue
Daarna correlatie opnieuw berekenen om te checken
Analyze -> correlate -> bivariate -> score en item116bis in variabele -> ok
Tweede manier
, Victoria Daneau - 2024
Variabele score aanmaken in transform -> compute variable -> target variabele “score” ->
Function group: statistical -> Functions and Special Variables: Sum(item…to item…)
Analyze -> correlate -> bivariate -> alle items selecteren -> paste -> aanpassen in syntax:
“item… tot item… WITH score.”
Positieve correlatie (enkel teken) -> alle items in zelfde richting
Negatieve correaltie (enkel teken) -> alle items niet in zelfde richting
Indien negatieve correlatie -> gaan hercoderen
Transform -> Compute variable -> Target variable: item116bis -> Numeric expression: 6
(=schaalscore) - item116 -> ok
Daarna correlatie opnieuw berekenen om te checken
Analyze -> correlate -> bivariate -> score en item116bis in variabele -> ok
Voorwaarde 2: Correlatiematrix (om interne consistentie na te gaan via Cronbach Alpha)
Analyze -> scale -> reliability analysis -> alle items bij items zetten -> statistics -> item, scale,
scale if item deleted aanduiden -> Tabel Reliability Statistics voor Cronbach Alpha
Pagina 14 cursus: tabel van Cotan voor waarden
In de tabel Item-Total Statistics bij Corrected Item-Total Correlation kun je ook de verkeerde
richting correlaties per item zien
Correlaties nagaan
Grafisch
Graphs -> Scatter/Dot -> Matrix Scatter -> define -> matrix variables : variabelen kiezen
Numerisch
Analyze -> correlate -> bivariate -> variabelen kiezen -> Pearson aanduiden
Z-score berekenen voor al je waarden per variabele
Analyze -> descriptive statistics -> descriptive -> variabele invoegen -> save standardized
values as variables aanvinken
Algemeen SPSS : Ontbrekende data
Algemeen SPSS : Verkennen van data
Outliers (extreme values)
Cijfermatig
Analyze -> descriptive statistics -> explore -> variabele kiezen -> statistics -> outliers
In tabel Extreme Values kijken
Cijfermatig via z-score
Stap 1: Analyze -> descriptive statistics -> descriptives -> variabele kiezen -> save
standardized values aanklikken -> ok
Stap 2: In data view je eerste variabele op “sort ascending” plaatsen
Stap 3: Je tweede variabele dat in Z-score staat op “sort ascending” plaatsen
Z-score onder -3 zijn extreem laag
Stap 4: In data view je eerste variabele op “sort descending” plaatsen
Stap 5: Je tweede variabele dat in Z-score staat op “sort descending” plaatsen en tabel
slepen naast je eerste variabele
Z-score vanaf 3 zijn extreem hoog
Grafisch
Analyze -> descriptive statistics -> explore -> variabele kiezen AV en factor list variabele
kiezen OV -> statistics -> outliers
° outliers
* extremes
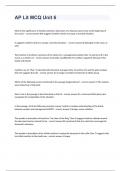
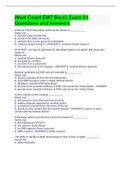
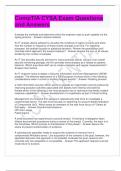
Univariaat Bivariaat Multivariaat
Mahalanobis D²
Frequentieverdeling / Spreidingsdiagram
(afstand van observatie tot
Histogram / boxplot (scatterplot)
midden van alle observaties)
n 80
absolute z-scores > 2.5 (“conservatief” gebruiken,
Beoordeling op zicht
n > 80 =.001)
absolute z-scores > 3 of 4
Percentielen
Analyze -> descriptive statistics -> explore -> statistics -> percentielen
Histogram
Analyze -> descriptive statistics -> explore -> plots -> histogram
, Victoria Daneau - 2024
Aantal cases met geldige waarnemingen voor alle variabelen/ nagaan waar er een
ontbrekende waarde is
Analyze -> descriptive statistics -> descriptives -> alle variabelen aanduiden -> ok -> Valid N
(listwise) helemaal onderaan in tabel
Bv. Valid N= 171 -> voor 171 cases zijn alle gegevens ingevuld. Er zijn hiervoor geen missings
Gemiddelde zonder de 5% uiterste waarnemingen
Analyze -> descriptive statistics -> explore -> variabele aanduiden in dependent variabele ->
ok -> 5% trimmed mean in tabel
Kijken naar verschil tussen normaal gemiddelde en 5% trimmed mean -> indien dat verschil
klein is dan zijn er niet veel extreme waarden
Histogram
Graphs -> histogram -> variabele kiezen
Histogram met normaalverdeling op
Graphs -> histogram -> variabele kiezen -> display normal curve aanduiden
OF
Dubbel klik op je histogram afbeelding -> elements -> show distribution curve
Boxplot voor vergelijking van twee groepen
Graphs -> boxplot -> simple en summaries for groups of cases -> AV in variabele -> variabele
waarvoor je groepen wilt in category axis (=factor)
Voorwaarde 1: Nagaan of items Reversed Coded zijn
Eerste manier
Variabele score aanmaken in transform -> compute variable -> target variabele “score” ->
Function group: statistical -> Functions and Special Variables: Sum(item…to item…)
Analyze -> correlate -> bivariate -> alle items selecteren -> paste -> aanpassen in syntax:
“item… tot item… WITH score.”
Positieve correlatie (enkel teken) -> alle items in zelfde richting
Negatieve correaltie (enkel teken) -> alle items niet in zelfde richting
Indien negatieve correlatie -> gaan hercoderen
Transform -> Recode into Different Variables -> item selecteren -> Name: item116bis ->
change -> Old and new values -> Value laagste value bv. 0 -> New Value hoogste value bv. 6
-> Add -> Value 1 -> New Value 5 -> Add -> Value 2 -> New Value 4 -> Add -> Value 3 -> New
Value 3 -> Add -> Value 4 -> New value 2 -> Add -> Value 5 -> New value 1 Add -> -> Value 6.
-> New value 0 -> Add -> continue
Daarna correlatie opnieuw berekenen om te checken
Analyze -> correlate -> bivariate -> score en item116bis in variabele -> ok
Tweede manier
, Victoria Daneau - 2024
Variabele score aanmaken in transform -> compute variable -> target variabele “score” ->
Function group: statistical -> Functions and Special Variables: Sum(item…to item…)
Analyze -> correlate -> bivariate -> alle items selecteren -> paste -> aanpassen in syntax:
“item… tot item… WITH score.”
Positieve correlatie (enkel teken) -> alle items in zelfde richting
Negatieve correaltie (enkel teken) -> alle items niet in zelfde richting
Indien negatieve correlatie -> gaan hercoderen
Transform -> Compute variable -> Target variable: item116bis -> Numeric expression: 6
(=schaalscore) - item116 -> ok
Daarna correlatie opnieuw berekenen om te checken
Analyze -> correlate -> bivariate -> score en item116bis in variabele -> ok
Voorwaarde 2: Correlatiematrix (om interne consistentie na te gaan via Cronbach Alpha)
Analyze -> scale -> reliability analysis -> alle items bij items zetten -> statistics -> item, scale,
scale if item deleted aanduiden -> Tabel Reliability Statistics voor Cronbach Alpha
Pagina 14 cursus: tabel van Cotan voor waarden
In de tabel Item-Total Statistics bij Corrected Item-Total Correlation kun je ook de verkeerde
richting correlaties per item zien
Correlaties nagaan
Grafisch
Graphs -> Scatter/Dot -> Matrix Scatter -> define -> matrix variables : variabelen kiezen
Numerisch
Analyze -> correlate -> bivariate -> variabelen kiezen -> Pearson aanduiden
Z-score berekenen voor al je waarden per variabele
Analyze -> descriptive statistics -> descriptive -> variabele invoegen -> save standardized
values as variables aanvinken
Algemeen SPSS : Ontbrekende data